Lucid Group Stock Price and Forecast: Will LCID finish the year at $60
- Lucid Group slumps by nearly 4% on Tuesday.
- Lucid has been surging along with most other electric vehicle stocks.
- LCID stock forming bullish triangle continuation pattern.

Lucid Group (LCID) stock suffered on Tuesday as the stock market took a hit from continuing uncertainty over the new Omicron covid variant and market man Powell actually trash talking. Powell said the taper is on and also curtly admitted that "transitory" might not be the best way to describe the ongoing and more persistent inflation problem. Duh! Nice to finally wake up and smell the ever more expensive coffee then.
At least now that the Fed has woken up they may decide to chase after the inflation curve and catch up to it. For now, though that is not helping equity markets. The taper tantrum is in full swing and volatility looks like it will be at least transitory. All this means high growth names like Lucid Group (LCID) will struggle for momentum and experience more volatility than the underlying indices. This is certainly proving to be the case with yesterday's 3.8% loss coming after a 6.5% gain on Monday.
-637739505213761446.png)
LCID 15-minute graph
Lucid Group (LCID) stock news
There has been a bit of controversy recently over the Lucid battery pack and the charging power needed for it. Traders have been arguing over rumours that the Lucid Air Dream battery pack has 118kWh of capacity, but a recent test by InsideEV Senior Editor showed that they were billed 134kWh to charge the battery back from 0 to 100% despite it only having a 118 kWh capacity. This led to all sorts of rumour, speculation and arguments among Lucid traders. However, a follow-up article by InsideEV returns to the article in question to try and clear up the issue. Keith Ritter wrote an article yesterday for InsideEV explaining the reasons for the confusion.
"But why, then, was Tom billed for 134 kWh? Based on my experience, thermal-modeling the heating losses incurred in extreme fast-charging sessions, it’s the law. Ohm’s law. And the 2nd law of thermodynamics. The 2nd law says “there are always losses in an energy transfer process”..."Rapidly adding 118 kWh to this pack and only suffering 16 kWh of 2nd-law losses is an EV engineering miracle, not a false-marketing conspiracy."
That at least may remove some of the uncertainty surrounding the stock and provide a short-term catalyst. We note LCID stock is up over 2% in Wednesday's premarket. Whether or not this article is the reason is unknown, but there certainly has been a lot of chatter on social media on this topic recently.
Lucid Group (LCID) stock forecast
The short-term chart gives us some important levels to be aware of over the next few sessions. LCID is stuck at present in a high-volume zone around $50 to $55. The volume profile bars (light green) on the right of the chart demonstrate this. Getting above or below should see a price acceleration due to a lack of volume. Volume nearly always equals price stability. Volume-based supports for the short term are, therefore, $45 and $38.
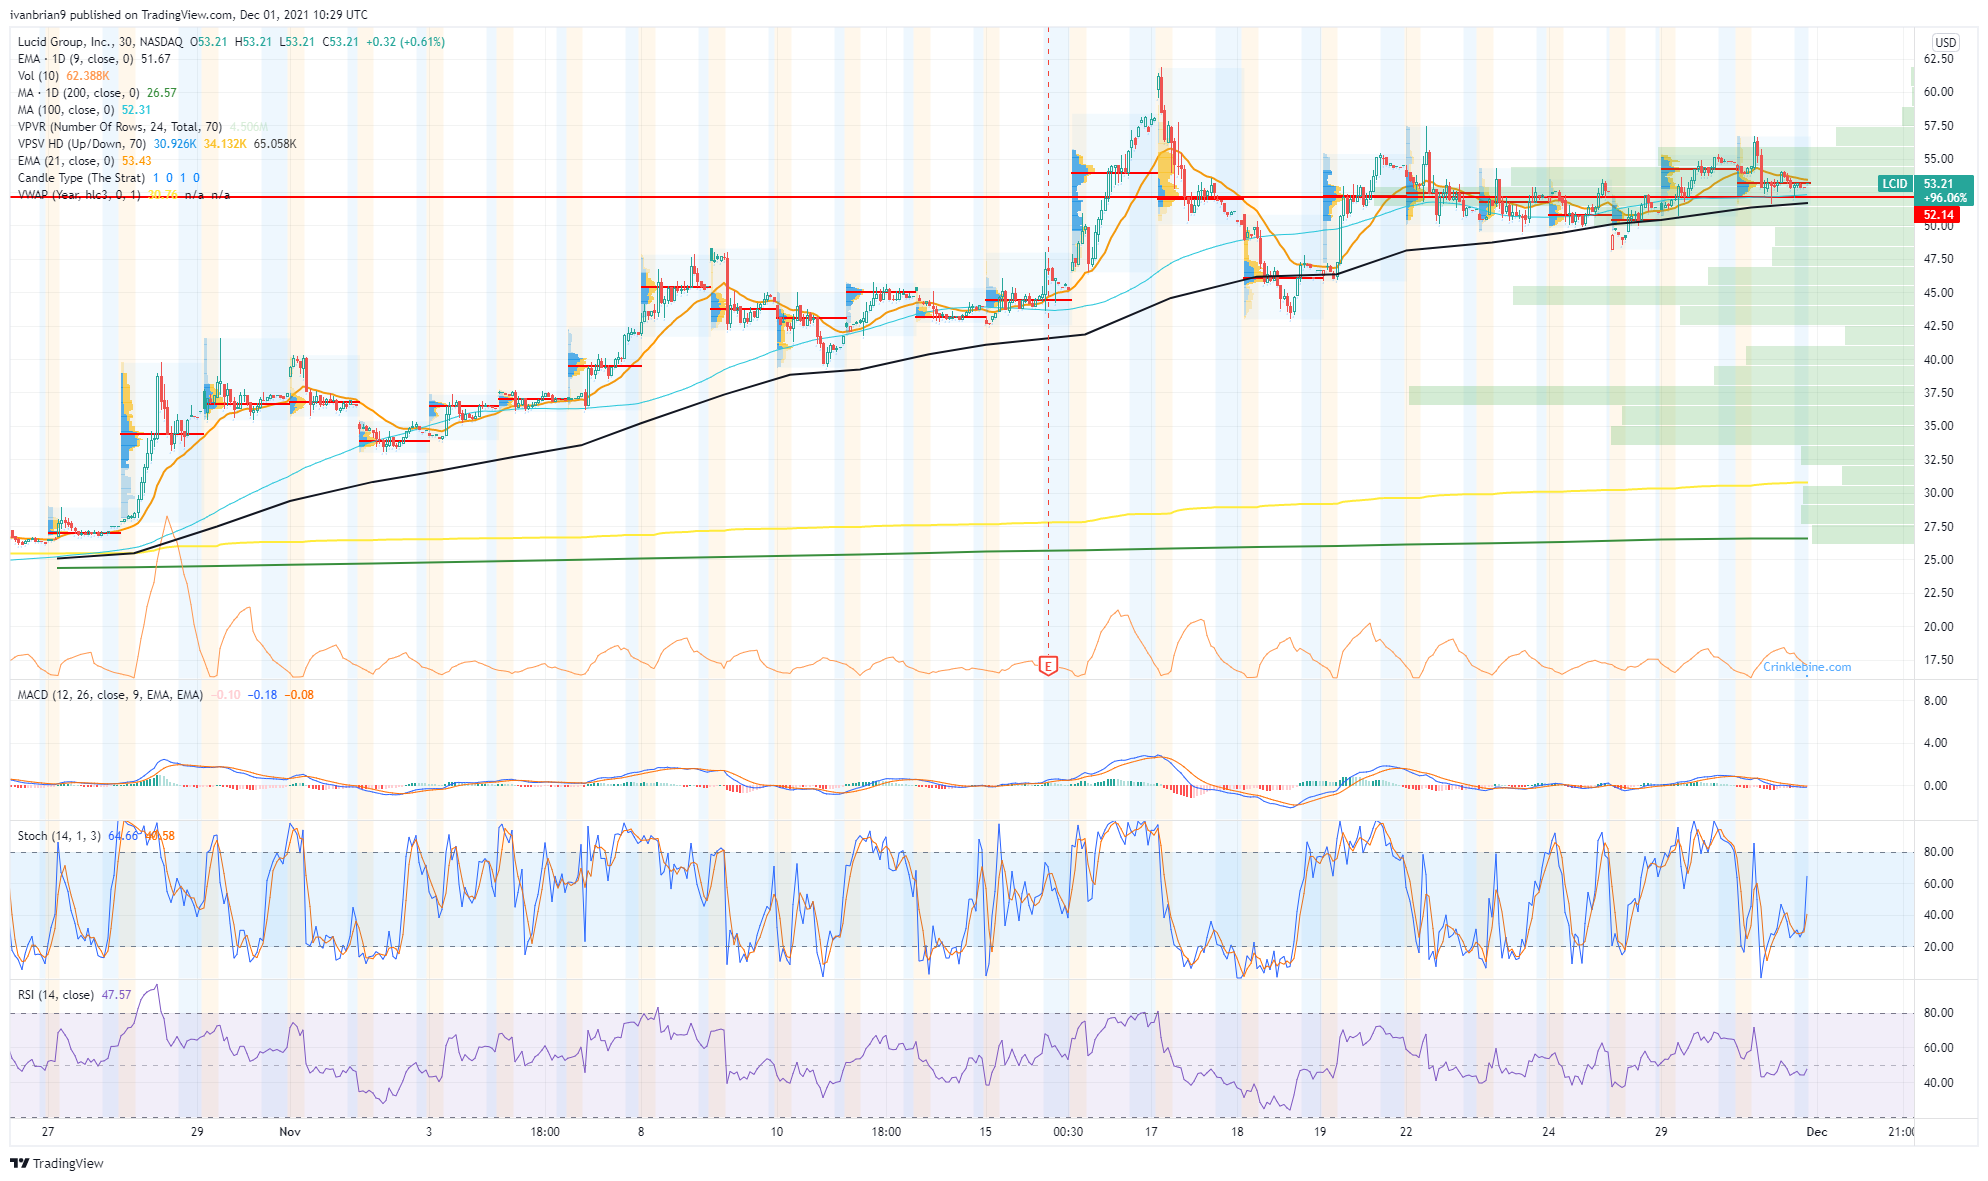
LCID 30-minute chart
The daily chart shows the decreasing range that is forming a triangle pattern. Triangles are generally continuation patterns, but this one is not too clean as the sharp red candle on November 18 demonstrates. Both the Relative Strength Index (RSI) and the Moving Average Convergence Divergence (MACD) are close to giving crossover sell signals, so keep an eye on this development.
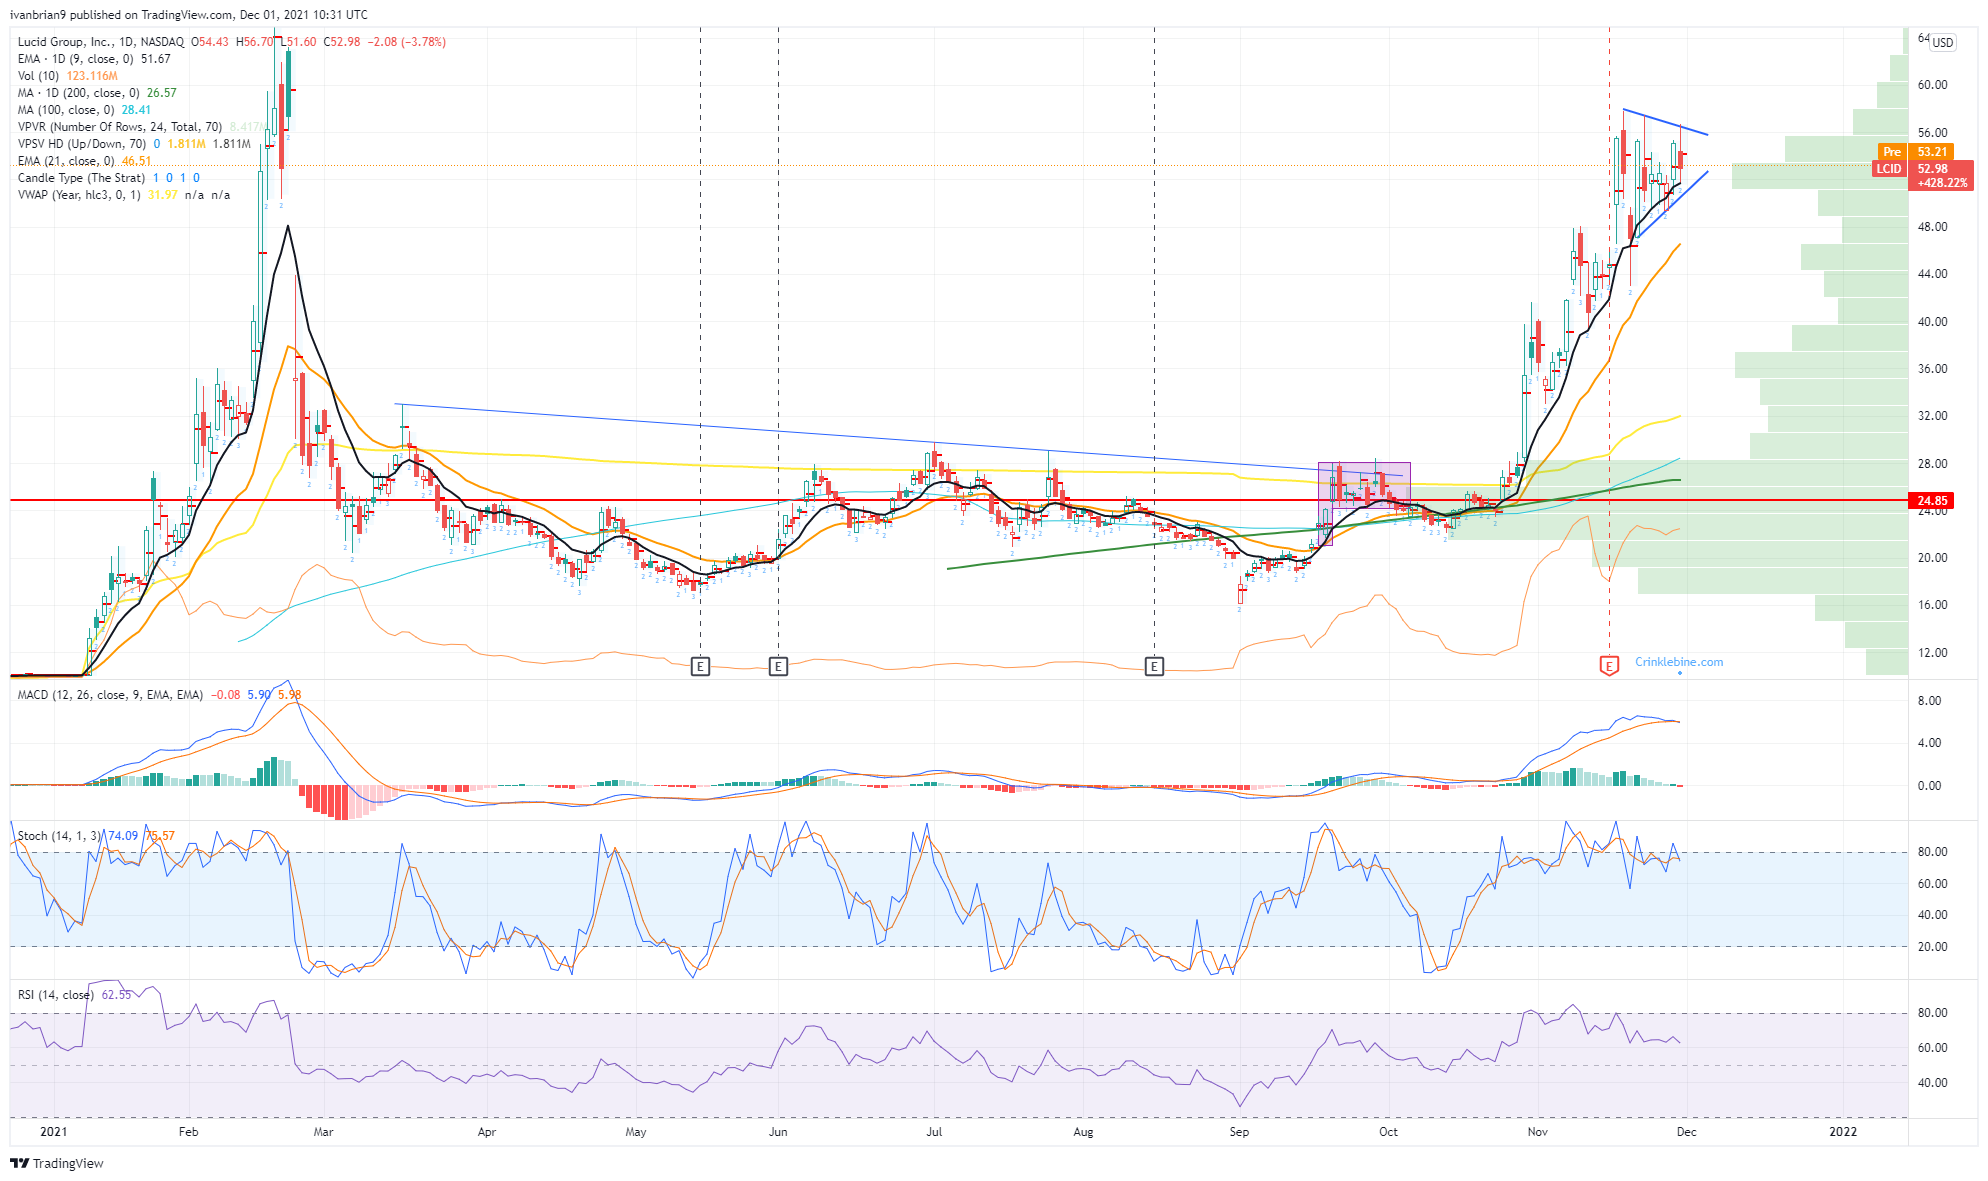
LCID 1-day chart
Like this article? Help us with some feedback by answering this survey:
Premium
You have reached your limit of 3 free articles for this month.
Start your subscription and get access to all our original articles.
Author

Ivan Brian
FXStreet
Ivan Brian started his career with AIB Bank in corporate finance and then worked for seven years at Baxter. He started as a macro analyst before becoming Head of Research and then CFO.


