Is Netflix (NFLX) back from the dead? Recent momentum raises eyebrows [Video]
![Is Netflix (NFLX) back from the dead? Recent momentum raises eyebrows [Video]](https://editorial.fxstreet.com/images/Markets/Equities/Industries/Media/Netflix.jpg)
Netflix, Inc (NFLX) the pioneer in streaming services, has maintained its dominant position in the industry with a diverse range of content and global reach. The company's investment in original programming has enabled it to withstand competition from new and existing services. Netflix offers movies, television shows, and documentaries across various genres and languages, accessible on internet-connected devices worldwide. Founded in 1997, the company started as a DVD-rental provider and expanded to streaming media and video on demand. It has since ventured into original productions, accounting for half of its library in the US by 2022. NFLX is listed on NASDAQ and is a component of Nasdaq 100 and S&P 500 under Telecommunication.
Tell-tale signs of Netflix wyckoff accumulation pattern
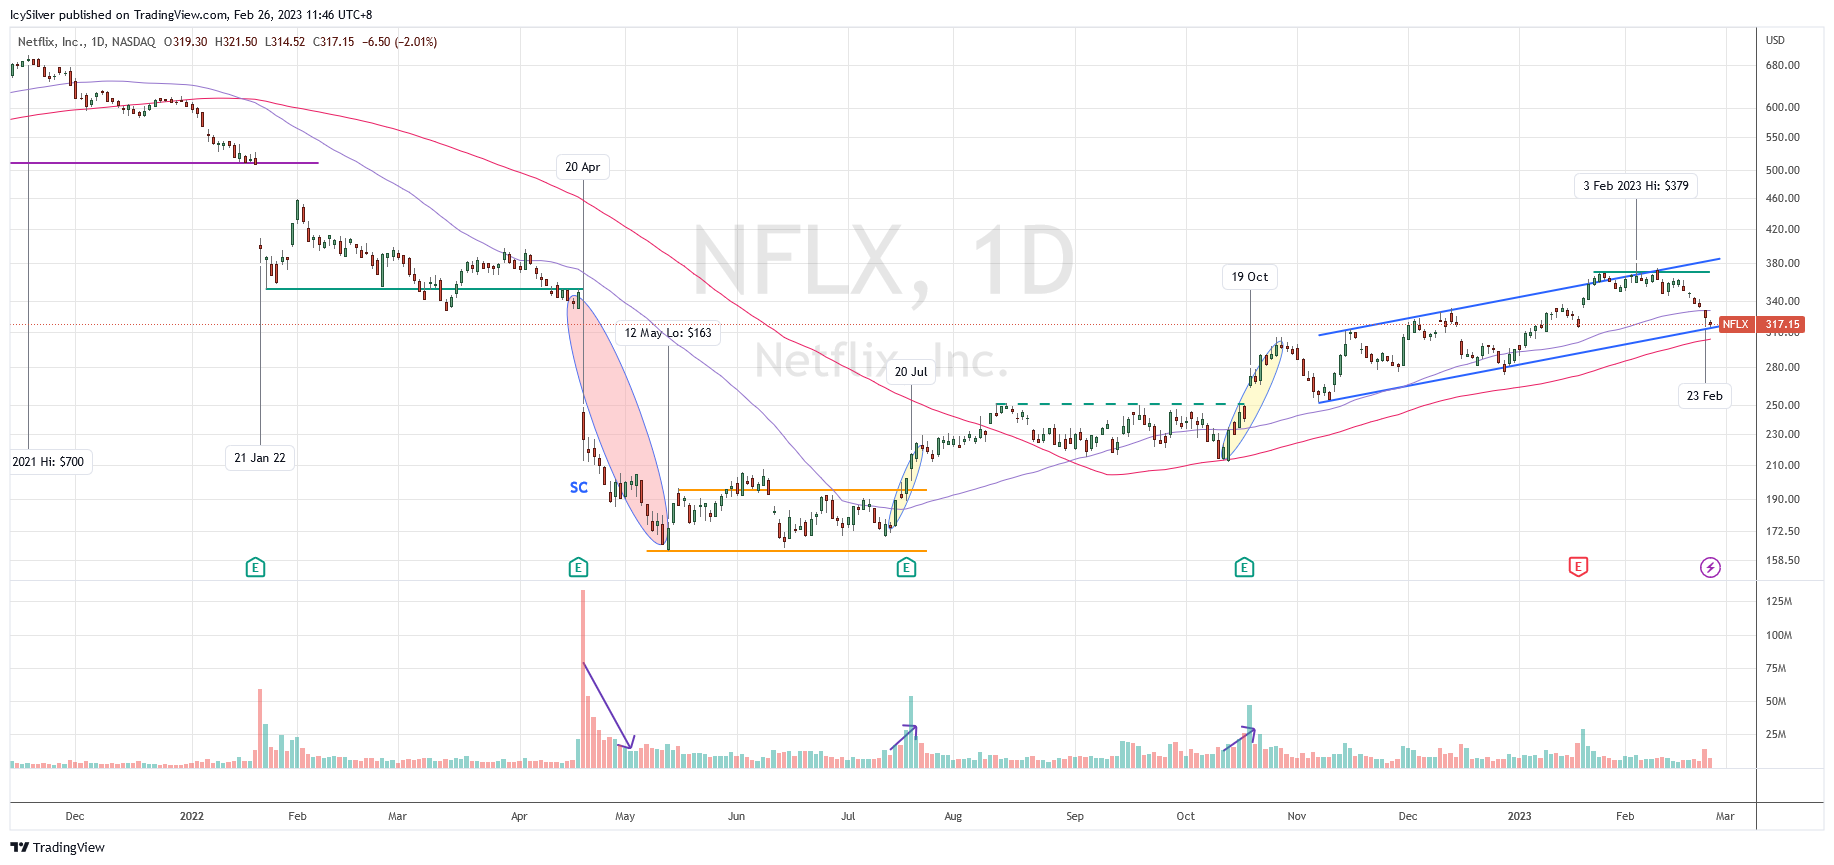
This NFLX chart is in log scale for clearer illustrators.
NFLX hit an all time high around $700 on 17 Nov 2021. However, the price started to retrace and on 21 Jan 2022, the price gap down by more than 20% with earning results as catalyst. This came with a spike in volume, suggesting the presence of supply. The trading range which started in April 2020 became a Wyckoff distribution phase. The price then found support around $352 and tried to stay above it but the inability of the price to rally up spelled more weakness ahead.
This set the stage for the Wyckoff redistribution phase. Another gap down on 20 Apr of took the price down another 35% and started a significant Wyckoff sign of weakness (SOW). This acceleration to the down side was accompanied by huge supply. The selling pressure continued and the price hit a low around $163 on 12 May. An automatic rally defined a small Wyckoff accumulation trading range between $163 and $195.
NFLX consolidated and broke out of the range with a Wyckoff sign of strength (SOS) rally on 20 July. The localized increase of volume suggests presence of demand as the price continued to stay committed above the trading range. Subsequently, the price managed to break above $251 with a SOS rally that began on 13 Oct.
The price extended the bullish momentum with an uptrending channel. It continuously formed higher high and higher low for the next few months. On 3 Feb 2023, NFLX hit $379 and attempted to stay above the $370 resistance. Nevertheless, it retraced to retest the support of the trading channel.
Bias
Slightly bullish. According to the Wyckoff method, NFLX is traveling within the uptrending channel. The hammer on 23 Feb coincided with the demand line of the up channel with localized increase in volume suggesting presence of demand. The price will likely rechallenge the $370 resistance. If the price is able to commit above $370, the next immediate resistance is at $400 and $450.
If the price breaks below $315, it is likely to retest the support around $250.
NFLX was discussed in detail in my weekly live group coaching on 7 Feb 2023 before the market opened. The improving market breadth together with many bullish trade entry setups could suggest a new bull run as discussed in the video below.
Author

Ming Jong Tey
Independent Analyst
Ming Jong Tey has been trading since 2008. He started his learning journey from technical analysis (indicators, Fibonacci, etc...) to value investing. Throughout his journey, he develops an interest in price action with chart pattern trading.


