Gold technical analysis: 21/50-HMA, 5-day old support-line limit immediate declines
- Technical indicators seem losing positive momentum, but strong downside supports question the declines.
- An upside clearance of $1438.65/1440 becomes necessary to aim for May 2013 high around $1474.

Even if oscillators like RSI and MACD are losing momentum on a shorter timeframe chart of Gold, strong supports on the south limits the yellow metal’s declines as it trades near $1418 during early Friday.
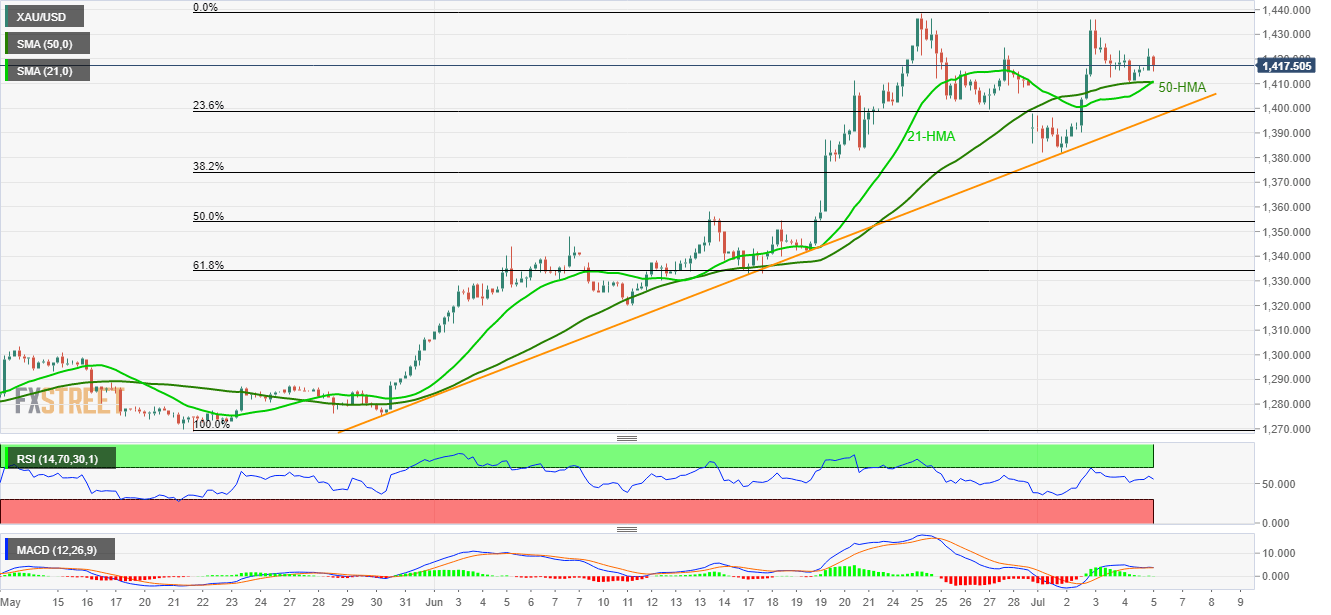
Among the supports, the confluence region of 21 and 50-hour moving averages (HMA) close to $1410/11 appears the first challenge to sellers, a break of which highlights the importance of 5-day old support-line, at $1396.
Given the price drop beneath $1396, bears can aim for $1382 and 50% Fibonacci retracement level of $1354.
Meanwhile, bulls’ ignorance to 14-bar relative strength index (RSI) and 12-bar moving average convergence divergence (MACD) histogram can push them towards $1338.65/40 area that holds the key for the bullion’s run-up to May 2013 high around $1474.
Gold hourly chart
Trend: Bullish
Author

Anil Panchal
FXStreet
Anil Panchal has nearly 15 years of experience in tracking financial markets. With a keen interest in macroeconomics, Anil aptly tracks global news/updates and stays well-informed about the global financial moves and their implications.


