Gold reverses gains from US PCE inflation data miss
- Gold reverses the gains made after the release of PCE inflation data shows price pressures cooled in April.
- Precious metal already made gains following the second estimate for US Q1 GDP which showed the economy expanded less than previously anticipated.
- Gold remains technically vulnerable after a breakout from the Bear Flag continuation pattern.

Gold (XAU/USD) slumps back into the $2,330s on Friday undoing the gains it made after the release of US Personal Consumption Expenditure (PCE) data for April, which showed cooling core price pressures. The PCE is the Federal Reserve's (Fed) prefered gauge of inflation and Core PCE cooled to 0.2% month-over-month, from 0.3% previously, according to data from the Bureau of Economic Analysis. Analysts had expected Core PCE to remain unchanged at 0.3%.
The rest of the PCE data came out in line with analysts estimates, however, the undershoot in Core PCE revealed inflation cooling in the US more quickly than analysts expected. This, as a consequence, increased the likelihood of the Fed cutting interest rates sooner rather than later. Lower interest rates tend to be positive for Gold as they reduce the opportunity cost of holding the non-yielding asset and the precious metal rose after the data.
The gains came on the back of a recovery that started on Thursday after the release of weaker US growth data, suggested inflation would remain contained, also leading to lower interest rate projections.
As traders wrap up for the weekend, however, Gold is pulling back down and may even end the day in the negative.
Gold recovers after US growth slows
Gold rebounded on Thursday after the second estimate of US first-quarter GDP growth showed a downward revision to an annualized 1.3% from 1.6% in the first estimate.
The slower growth came from lower consumer spending, which in turn is expected to keep inflation contained, and the Federal Reserve (Fed) on track to lower interest rates. In a reflection of changing expectations after the GDP release, the US 10-year Treasury Note yield dropped back to 4.55% from a four-week peak of 4.63%.
The probabilities of the Fed cutting interest rates before September are insignificant but stand at 55% for a cut in September, data from the CME FedWatch Tool shows.
Gold and Asian demand as a currency hedge
US interest-rate expectations are not the only factor influencing the Gold price, according to Daniel Ghali, a Senior Commodity Strategist at TD Securities.
Ghali’s research shows that Gold demand is being driven by Asian buyers who are hoarding the precious metal as a hedge as their currencies depreciate against a strengthening US Dollar (USD).
“Precious metals are acting as a currency depreciation hedge. Case in point: fund flows into Chinese gold ETFs are rising once more at their fastest pace since the massive buying activity observed in April. US yields are surging, the dollar broke out of its lull, and yet precious metals prices have remained extremely resilient,” says Ghali.
This suggests the strength of the US Dollar may not be as negatively correlated to Gold as it was in the past, and Gold prices could be capped in the event of an appreciation of USD.
Technical Analysis: Gold poised for weakness after breakout from Bear Flag
Gold price has broken out of a slanted rectangular formation (red-shaded area), probably a Bear Flag continuation price pattern which formed between May 24 and 27.
The breakout activates the Bear Flag’s downside target zone of between $2,303 and $2,295. A break below Thursday’s $2,322 lows would provide further bearish confirmation.
XAU/USD 4-hour Chart
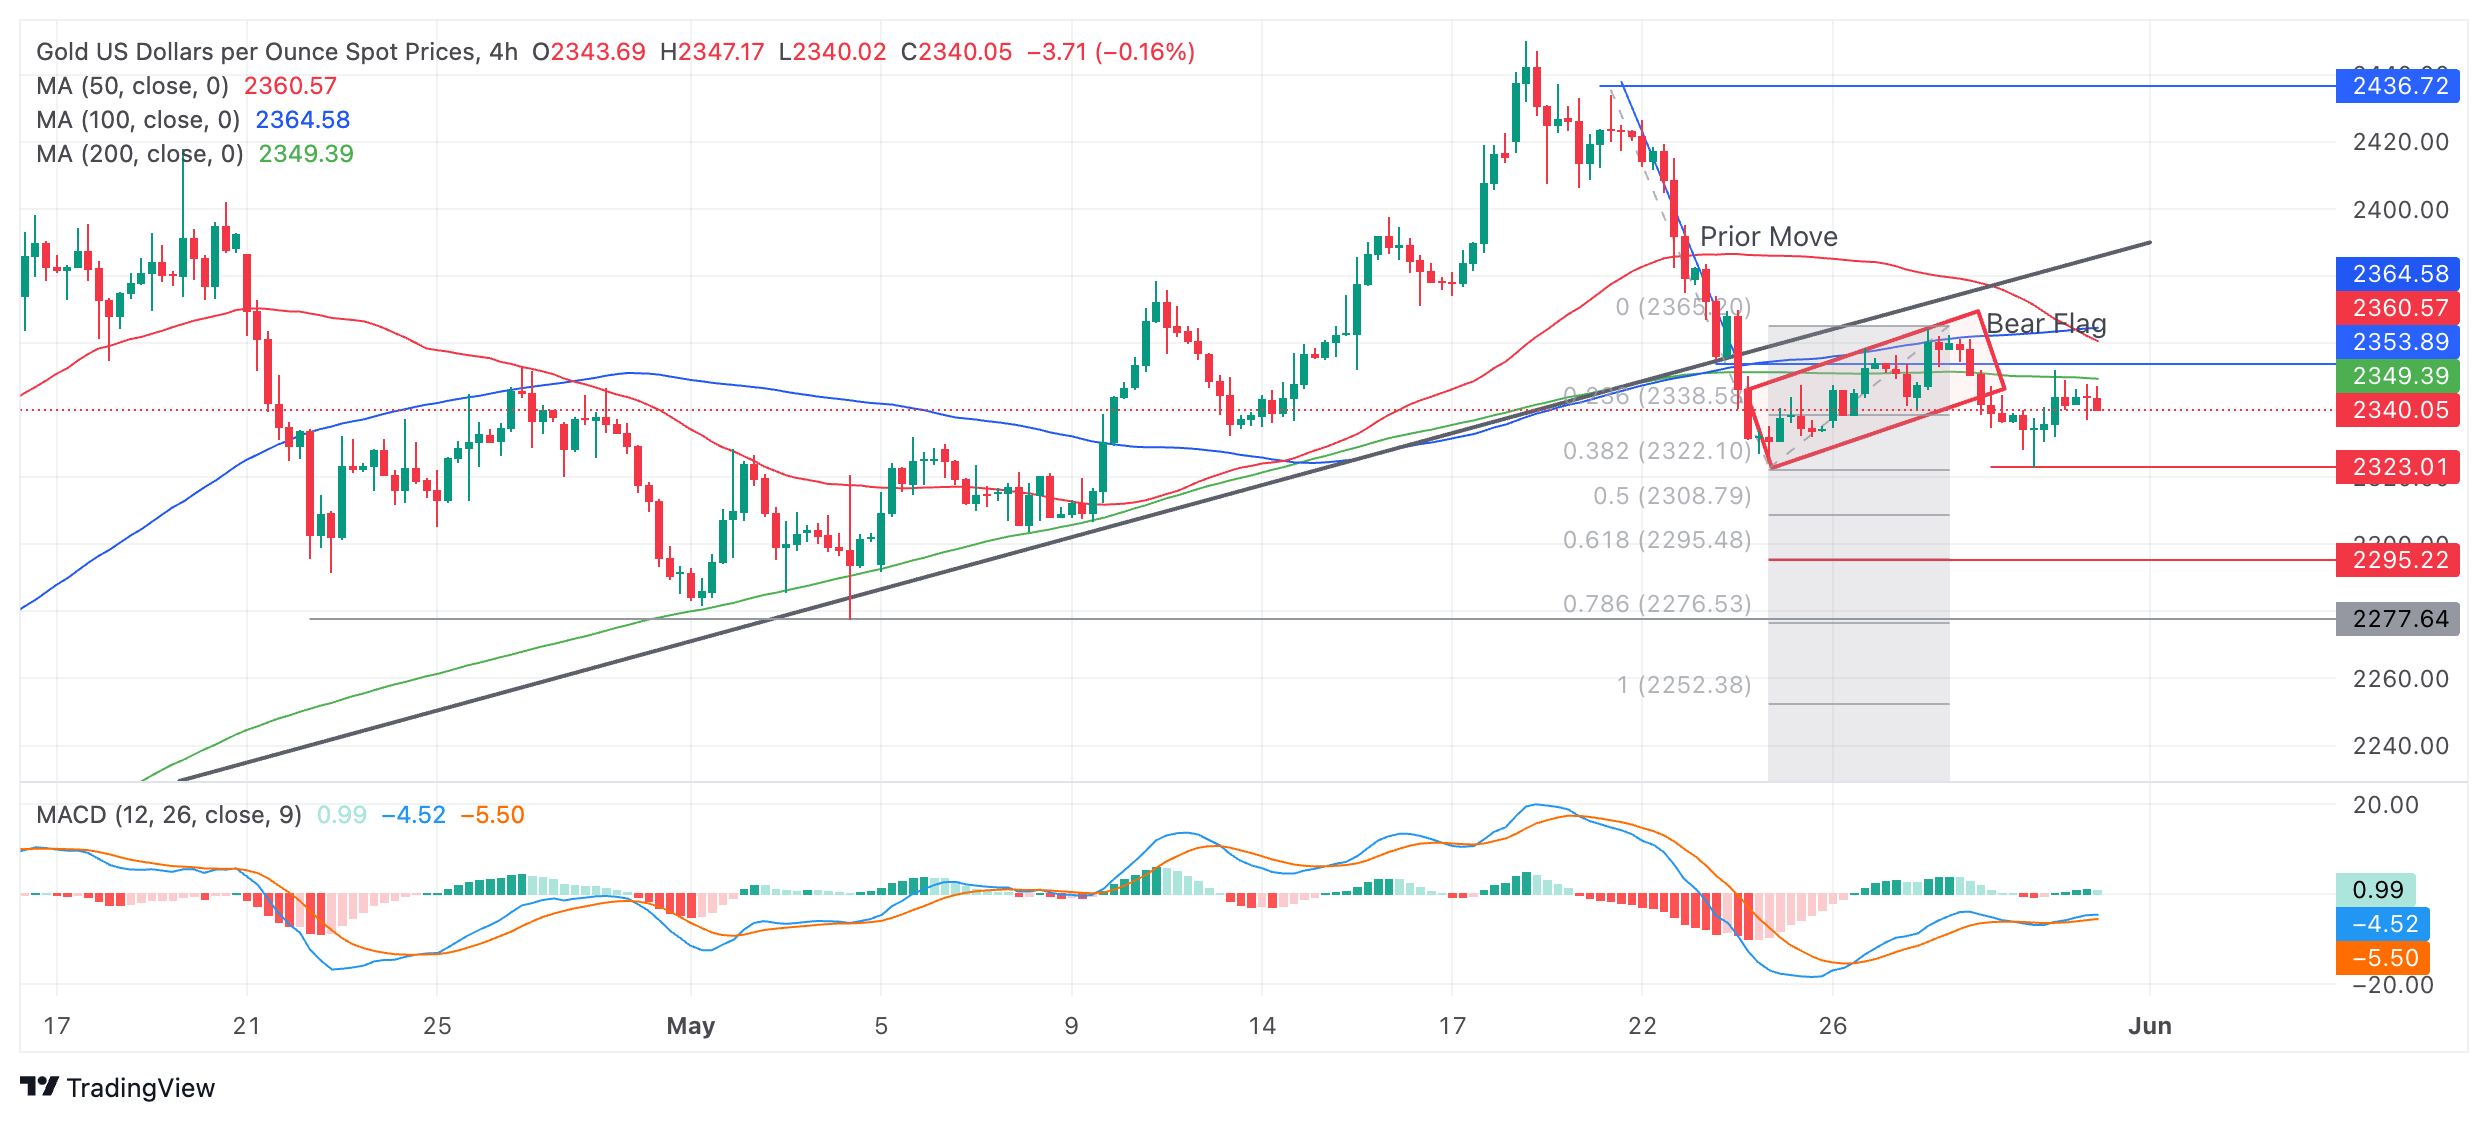
Bear Flags look like upside-down flags composed of a sharp decline – the flagpole – and the consolidation phase or “flag square”.
A more bearish move could even see Gold fall to $2,272-$2,277 (the 100% extrapolation of the move prior to the trend-line break and historic support and resistance).
Gold's 4-hour chart, used to assess the short-term trend, now exhibits a sequence of declining peaks and troughs, suggesting it is in a short-term downtrend and favoring short positions over longs.
The precious metal’s medium and long-term trends are still bullish, however, suggesting the risk of a recovery remains high. That said, price action is not supporting a resumption hypothesis at the moment.
A decisive break back above the trendline, now at around $2,385, would be required to provide evidence of a recovery and reversal of the short-term downtrend.
A decisive break would be one accompanied by a long green bullish candle or three green candles in a row.
Economic Indicator
Core Personal Consumption Expenditures - Price Index (YoY)
The Core Personal Consumption Expenditures (PCE), released by the US Bureau of Economic Analysis on a monthly basis, measures the changes in the prices of goods and services purchased by consumers in the United States (US). The PCE Price Index is also the Federal Reserve’s (Fed) preferred gauge of inflation. The YoY reading compares the prices of goods in the reference month to the same month a year earlier. The core reading excludes the so-called more volatile food and energy components to give a more accurate measurement of price pressures." Generally, a high reading is bullish for the US Dollar (USD), while a low reading is bearish.
Read more.Last release: Fri May 31, 2024 12:30
Frequency: Monthly
Actual: 2.8%
Consensus: 2.8%
Previous: 2.8%
Source: US Bureau of Economic Analysis
After publishing the GDP report, the US Bureau of Economic Analysis releases the Personal Consumption Expenditures (PCE) Price Index data alongside the monthly changes in Personal Spending and Personal Income. FOMC policymakers use the annual Core PCE Price Index, which excludes volatile food and energy prices, as their primary gauge of inflation. A stronger-than-expected reading could help the USD outperform its rivals as it would hint at a possible hawkish shift in the Fed’s forward guidance and vice versa.
Author

Joaquin Monfort
FXStreet
Joaquin Monfort is a financial writer and analyst with over 10 years experience writing about financial markets and alt data. He holds a degree in Anthropology from London University and a Diploma in Technical analysis.


