Gold falls overriding dovish Fed signals ahead Powell speech
- Gold retreats from a record high of $2,531 as US Treasury yields rise, with the 10-year note up 6.5 bps to 3.865%.
- US data shows mixed signals, with higher jobless claims and solid business activity despite ongoing manufacturing contraction.
- Fed Minutes hint at potential rate cut in September, but stronger US Dollar pressures Gold lower.

Gold price retreats on Thursday after running during the last five days to an all-time high (ATH) of $2,531. XAU/USD slumped below the previous ATH of $2,483 during Thursday’s session.
A tick up in US Treasury bond yields following the data release in the United States (US), bolstered the Greenback and weighed on the golden metal. The XAU/USD trades at $2,482, down by over 1%.
Data from the US Bureau of Labor Statistics (BLS) revealed that the number of Americans filing for unemployment benefits rose above estimates and the prior reading figures. Other data showed that Business Activity remains solid, even though manufacturing activity contracted for the second straight month, according to S&P Global.
Bullion traders digested the Federal Open Market Committee’s (FOMC) last meeting Minutes, released on Wednesday, which surprisingly showed that the “vast majority” of FOMC participants supported the case to ease policy at the September meeting if data met expectations.
The Minutes showed that policymakers had grown confident that inflation risks are skewed to the downside, while risks of achieving maximum employment had risen.
Boston Fed President Susan Collins echoed some of those views, commenting that the labor market is healthy and adding that it would be appropriate to lower interest rates soon. Recently, Philadelphia Fed Patrick Harker agreed with Collins on easing policy but added that the Fed should be methodical in cutting interest rates.
The non-yielding metal dipped even though Collins and Harker's views hinted at the first Fed cut. The rise in US bond yields, particularly the 10-year benchmark note up six and half basis points (bps) to 3.865%, boosted the buck. The US Dollar Index (DXY), which tracks the Greenback’s value against the other six currencies, rose by 0.39% to 101.52.
Given the backdrop, investors are preparing for Fed Chair Jerome Powell's commencement speech at Jackson Hole. In it, he’s expected to lay the groundwork for monetary policy for the second half of 2024.
Daily digest market movers: Gold price on the defensive post-US data
- Given the fundamental backdrop, profit-taking could be blamed as the main driver of Gold’s dip below $2,500 ahead of Powell’s speech.
- After today’s data, traders moderated their bets of the total amount of easing by the Fed in 2024, from around 102 bps to 94, via the Chicago Board of Trade (CBOT) December 2024 fed funds rate futures contract.
- US Jobless Claims rose to 232K in the week ending August 17, surpassing expectations of 230K and previous week's 228K.
- S&P Global Manufacturing PMI contracts again to 48.0; Services PMI rises to 55.2, beating estimates.
- US Existing Home Sales increased 1.3% in August, as expected, from 3.9 million to 3.95 million.
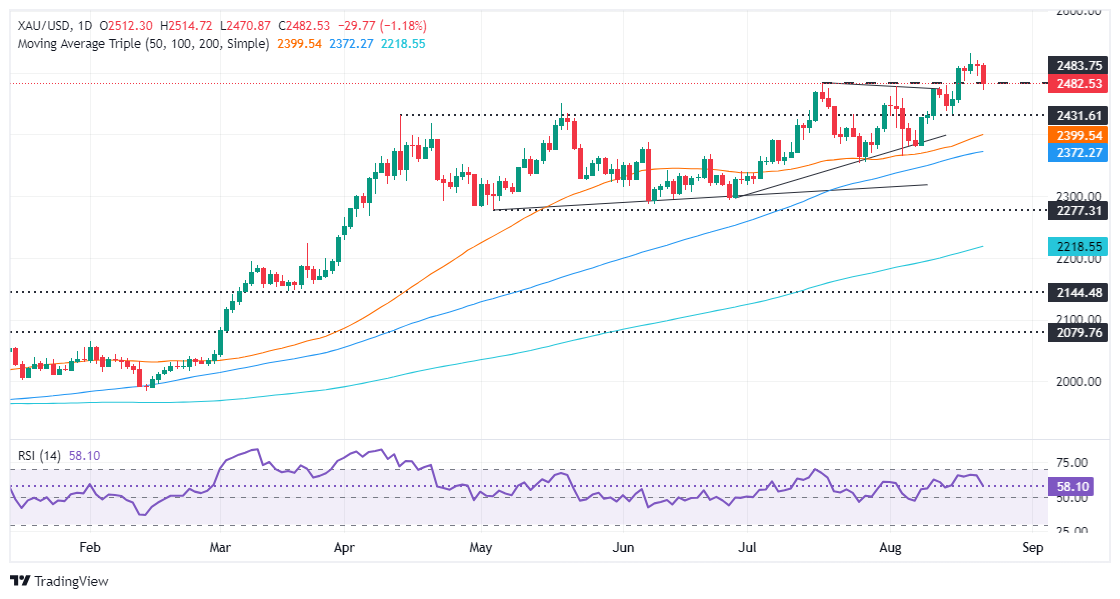
Technical outlook: Gold uptrend remains intact, despite surrendering $2,500
Gold’s uptrend remains intact, but a daily close below the previous ATH of $2,483 can trigger a deeper pullback.
The Relative Strength Index (RSI), despite being bullish, aims downwards, hinting that in the near term, sellers have the upper hand. Nevertheless, traders should be aware that in the mid-term, Gold is bullish.
If XAU/USD achieves a daily close below $2,500, sellers could push prices toward the May 20 peak of $2,450. Once that level is surpassed, further losses lie, and Gold could drop to the 50-day Simple Moving Average (SMA) at $2,398 before testing the next support at the 100-day SMA at $2,377.
On the other hand, if buyers lift Gold above $2,500, look for a re-test of the ATH at $2,531.
Gold FAQs
Gold has played a key role in human’s history as it has been widely used as a store of value and medium of exchange. Currently, apart from its shine and usage for jewelry, the precious metal is widely seen as a safe-haven asset, meaning that it is considered a good investment during turbulent times. Gold is also widely seen as a hedge against inflation and against depreciating currencies as it doesn’t rely on any specific issuer or government.
Central banks are the biggest Gold holders. In their aim to support their currencies in turbulent times, central banks tend to diversify their reserves and buy Gold to improve the perceived strength of the economy and the currency. High Gold reserves can be a source of trust for a country’s solvency. Central banks added 1,136 tonnes of Gold worth around $70 billion to their reserves in 2022, according to data from the World Gold Council. This is the highest yearly purchase since records began. Central banks from emerging economies such as China, India and Turkey are quickly increasing their Gold reserves.
Gold has an inverse correlation with the US Dollar and US Treasuries, which are both major reserve and safe-haven assets. When the Dollar depreciates, Gold tends to rise, enabling investors and central banks to diversify their assets in turbulent times. Gold is also inversely correlated with risk assets. A rally in the stock market tends to weaken Gold price, while sell-offs in riskier markets tend to favor the precious metal.
The price can move due to a wide range of factors. Geopolitical instability or fears of a deep recession can quickly make Gold price escalate due to its safe-haven status. As a yield-less asset, Gold tends to rise with lower interest rates, while higher cost of money usually weighs down on the yellow metal. Still, most moves depend on how the US Dollar (USD) behaves as the asset is priced in dollars (XAU/USD). A strong Dollar tends to keep the price of Gold controlled, whereas a weaker Dollar is likely to push Gold prices up.
Author

Christian Borjon Valencia
FXStreet
Markets analyst, news editor, and trading instructor with over 14 years of experience across FX, commodities, US equity indices, and global macro markets.


