Gold price shines as US Dollar dwindles pre-release of US PCE
- Gold climbs as USD falls, Treasury yields dip.
- XAU/USD rebounds from two-week low following inflation data from Canada and Australia.
- DXY drops 0.12% to 105.91, off monthly high of 106.13.
- Anticipation for May PCE drops to 2.6% YoY, with Core PCE also expected at 2.6%.

Gold rallied more than 1% on Thursday after economic data. The softer Greenback, which is retreating after posting solid gains, undermined lower US Treasury bond yields. US economic data was slightly better than expected, though ebbs and flows toward the golden metal kept XAU/USD trading at $2,326.
Yesterday, XAU/USD dived to a two-week low, sponsored by the release of inflation figures in Canada and Australia that showcased a reacceleration of inflation. This sponsored a jump in most global bond yields, particularly US Treasury yields, and was capitalized by US Dollar bulls.
The US Dollar Index (DXY), which tracks the buck’s performance against a basket of other currencies, hit a new monthly high of 106.13 before erasing some of those gains on Thursday as it tumbled 0.12% to 105.91.
The Gross Domestic Product (GDP) for the first quarter of 2024 in the United States was a tenth higher than forecasts, news already priced in by the markets. Besides that, the number of Americans filing for unemployment benefits dipped compared to last week’s data, while Durable Goods Orders exceeded projections.
This week, the Federal Reserve’s (Fed) preferred gauge for inflation, the May PCE, is expected to decrease from 2.7% to 2.6% YoY. Core PCE is anticipated to decline from 2.8% to 2.6% YoY.
Daily digest market movers: Gold price advances, capitalizing on soft US Dollar
- US GDP for Q1 2024 came in at 1.4% QoQ, slightly higher than the 1.3% in the previous two readings but still trailing last year's fourth-quarter expansion of 3.4%.
- US Durable Goods Orders in May rose by 0.1% MoM, surpassing forecasts of a -0.1% contraction. Meanwhile, Initial Jobless Claims dipped from 239K the previous week to 233K, below the forecast of 236K.
- Fed officials crossed the newswires during the week, and delivered mixed stances. Fed Governor Michelle Bowman was hawkish, saying that she would like to increase rates if the disinflation process stalls.
- Conversely, San Francisco Fed President Mary Daly was dovish: “At this point, inflation is not the only risk we face,” expressing worries about the labor market.
- Fed Governor Lisa Cook was neutral on Tuesday, saying that inflation was most likely to fall “sharply” next year, adding that it would be necessary to ease policy to keep the Fed’s dual mandate more balanced.
- According to the CME FedWatch Tool, odds for a 25-basis-point Fed rate cut in September are at 59.5%, up from 56.3% last Tuesday.
- December 2024 fed funds rate futures contract implies the Fed will ease policy by just 35 basis points (bps) toward the end of the year.
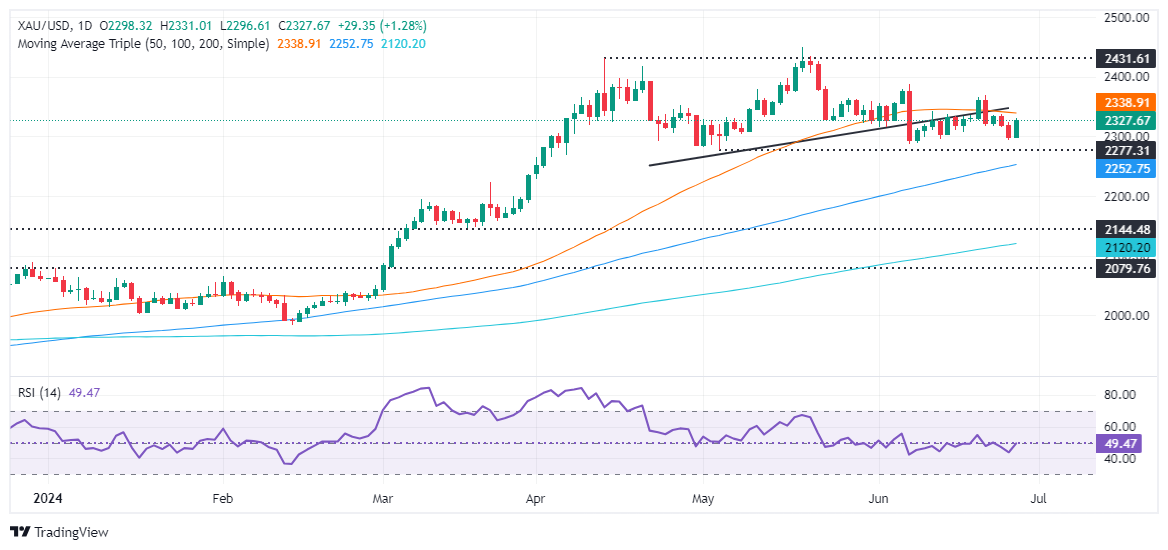
Technical analysis: Gold price edges higher but remains shy of testing Head-and-Shoulders neckline
Gold remains under pressure as the Head-and-Shoulders chart pattern remains intact, hinting that prices could fall further and clear key support levels. Although XAU/USD traded higher on Thursday, it remains shy of challenging the Head-and-shoulders neckline. If the latter is decisively broken, that could negate the pattern and pave the way to test the June 21 high of $2,368.
Momentum favors sellers as shown by the Relative Strength Index (RSI) standing below the 50-midline.
That said, the XAU/USD next support would be $2,300. Once cleared, the non-yielding metal would fall to $2,277, the May 3 low, followed by the March 21 high of $2,222. Further losses lie underneath, with sellers eyeing the Head-and-Shoulders chart pattern objective from $2,170 to $2,160.
Conversely, if Gold reclaims $2,350, that will expose additional key resistance levels like the June 7 cycle high of $2,387, ahead of challenging the $2,400 figure.
Economic Indicator
Personal Consumption Expenditures - Price Index (MoM)
The Personal Consumption Expenditures (PCE), released by the US Bureau of Economic Analysis on a monthly basis, measures the changes in the prices of goods and services purchased by consumers in the United States (US).. The MoM figure compares prices in the reference month to the previous month. Price changes may cause consumers to switch from buying one good to another and the PCE Deflator can account for such substitutions. This makes it the preferred measure of inflation for the Federal Reserve. Generally speaking, a high reading is bullish for the US Dollar (USD), while a low reading is bearish.
Read more.Next release: Fri Jun 28, 2024 12:30
Frequency: Monthly
Consensus: 0%
Previous: 0.3%
Source: US Bureau of Economic Analysis
Author

Christian Borjon Valencia
FXStreet
Markets analyst, news editor, and trading instructor with over 14 years of experience across FX, commodities, US equity indices, and global macro markets.

















