Gold: Is there just a hint of positive bias beginning to show through? [Video]
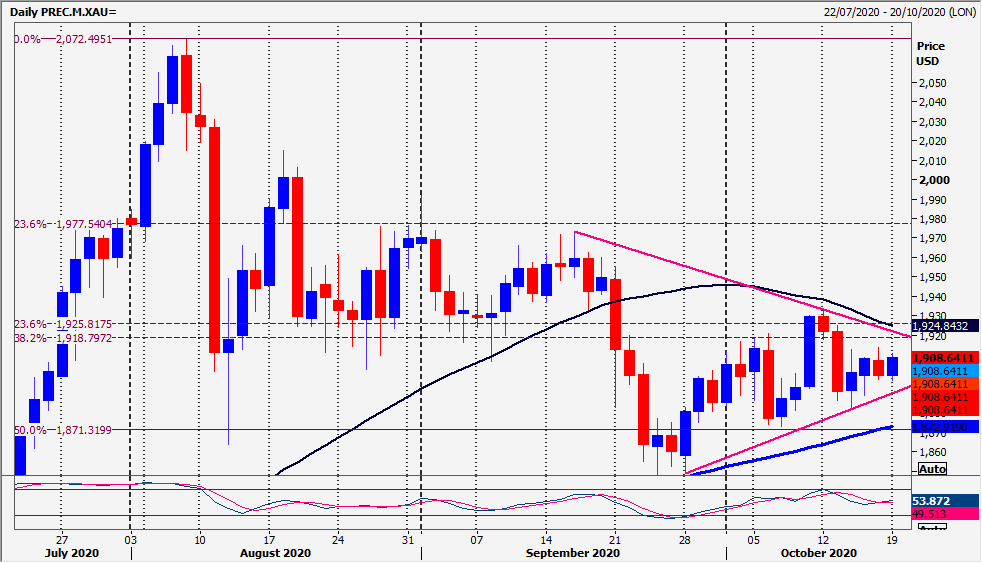
We have seen so many major markets (forex and commodities) consolidating recently. This is the same with gold, but is there just a hint of positive bias beginning to show through? The two trendlines continue to converge (six month uptrend now at $1885, two month downtrend now at $1925), but with the market just putting together a run of higher lows and higher highs in the past month, there is a bias towards testing the downtrend now. Early gains today are helping to forge this view and if the market closes around here tonight, it would be three positive closes in the past four sessions. Trading back above $1902 also adds to the mild sense of improvement. The key resistance remains $1933, but a close above the 23.6% Fibonacci retracement (of $1451/$2072) at $1926 comes with increasing positive intent now. Read More...
Gold Spot trades in a sideways triangle pattern
Gold holding below 1899 tests 1 month trend line support at 1890. A break lower tests last week's low at 1883/82. Be ready to sell a break below to test October's low & 100 day moving average support at 1873/72. Try longs with stops below 1868. A break lower is a sell signal, initially targeting 1850/48.
Holding above 1904 targets 1913/15. A break above 1917 targets 1923/24 & 1 month trend line resistance at 1926/28. Try shorts with stops above 1932. A break higher is a medium term buy signal. Read More...
Gold technical analysis: Gold ranges between 50 and 100 SMAs; momentum feeble
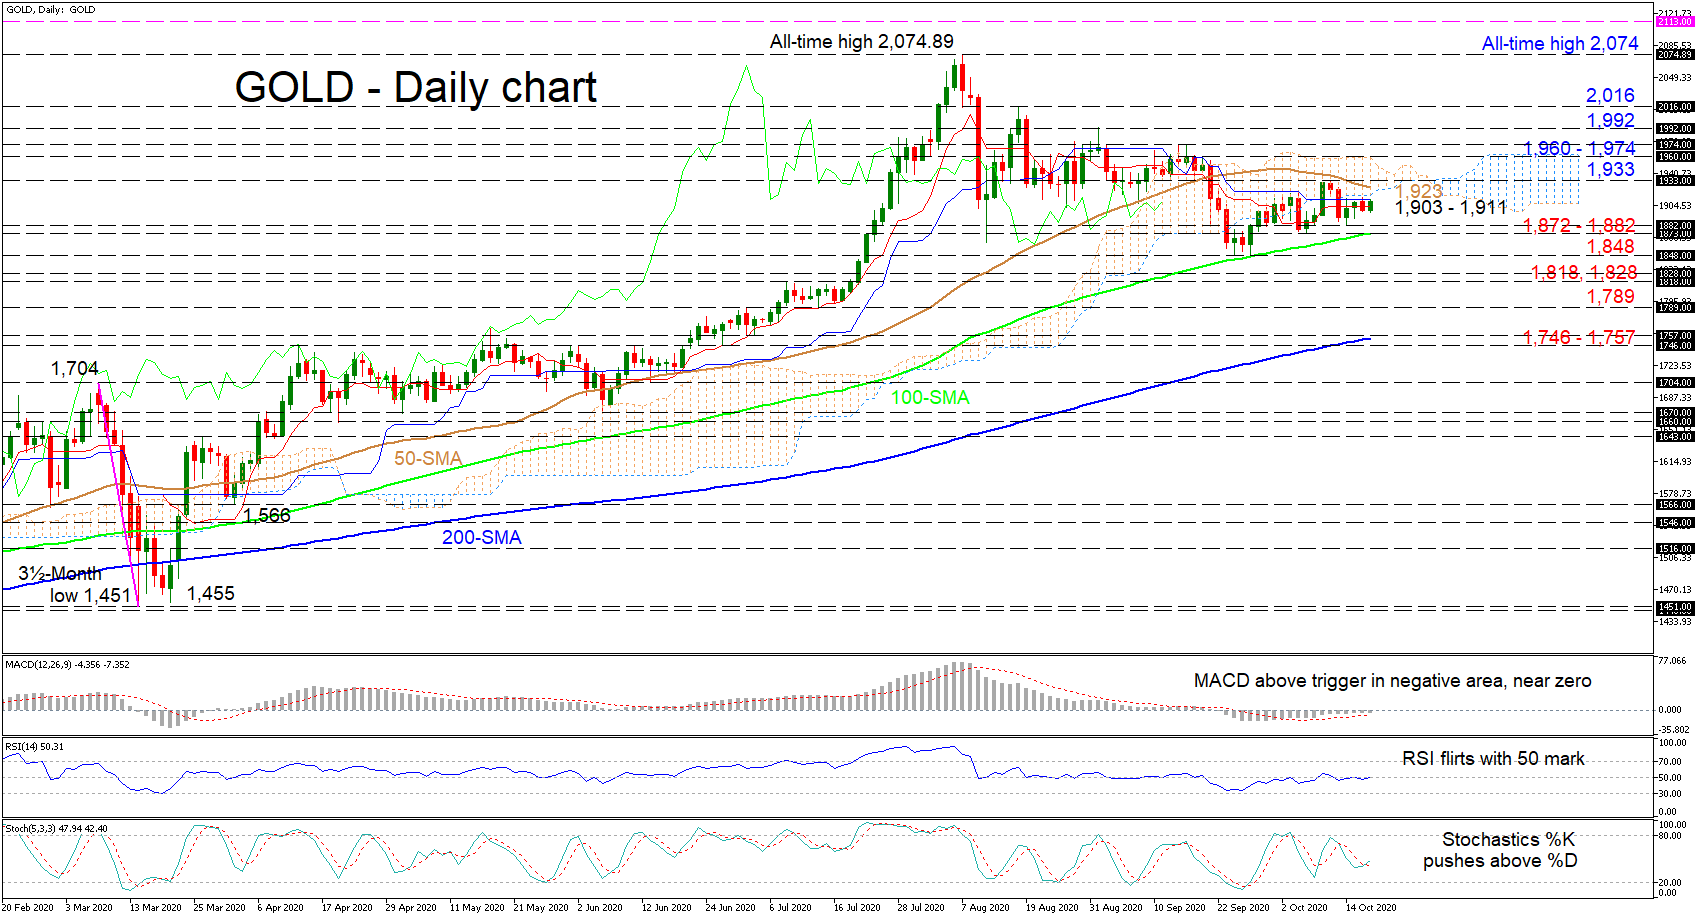
Gold seems to be adopting a sideways pattern after retreating under the Ichimoku cloud. The guiding and constricting 50- and 100-day simple moving averages (SMAs), as well as the horizontal Ichimoku lines, further back the suspended picture of the commodity.
The short-term oscillators suggest a frozen state of directional momentum. The MACD, in the negative region, is holding above its red signal line but slightly below its zero mark, while the RSI is zig zagging around its neutral threshold. A completed bullish overlap between the stochastic lines endorses the marginal improvement in the price. Nonetheless, the predominant bullish tone of the SMAs remains intact for now. Read More...
Information on these pages contains forward-looking statements that involve risks and uncertainties. Markets and instruments profiled on this page are for informational purposes only and should not in any way come across as a recommendation to buy or sell in these assets. You should do your own thorough research before making any investment decisions. FXStreet does not in any way guarantee that this information is free from mistakes, errors, or material misstatements. It also does not guarantee that this information is of a timely nature. Investing in Open Markets involves a great deal of risk, including the loss of all or a portion of your investment, as well as emotional distress. All risks, losses and costs associated with investing, including total loss of principal, are your responsibility. The views and opinions expressed in this article are those of the authors and do not necessarily reflect the official policy or position of FXStreet nor its advertisers. The author will not be held responsible for information that is found at the end of links posted on this page.
If not otherwise explicitly mentioned in the body of the article, at the time of writing, the author has no position in any stock mentioned in this article and no business relationship with any company mentioned. The author has not received compensation for writing this article, other than from FXStreet.
FXStreet and the author do not provide personalized recommendations. The author makes no representations as to the accuracy, completeness, or suitability of this information. FXStreet and the author will not be liable for any errors, omissions or any losses, injuries or damages arising from this information and its display or use. Errors and omissions excepted.
The author and FXStreet are not registered investment advisors and nothing in this article is intended to be investment advice.
Recommended content
Editors’ Picks
EUR/USD trades with negative bias, holds above 1.0700 as traders await US PCE Price Index

EUR/USD edges lower during the Asian session on Friday and moves away from a two-week high, around the 1.0740 area touched the previous day. Spot prices trade around the 1.0725-1.0720 region and remain at the mercy of the US Dollar price dynamics ahead of the crucial US data.
USD/JPY jumps above 156.00 on BoJ's steady policy

USD/JPY has come under intense buying pressure, surging past 156.00 after the Bank of Japan kept the key rate unchanged but tweaked its policy statement. The BoJ maintained its fiscal year 2024 and 2025 core inflation forecasts, disappointing the Japanese Yen buyers.
Gold price flatlines as traders look to US PCE Price Index for some meaningful impetus

Gold price lacks any firm intraday direction and is influenced by a combination of diverging forces. The weaker US GDP print and a rise in US inflation benefit the metal amid subdued USD demand. Hawkish Fed expectations cap the upside as traders await the release of the US PCE Price Index.
Sei Price Prediction: SEI is in the zone of interest after a 10% leap

Sei price has been in recovery mode for almost ten days now, following a fall of almost 65% beginning in mid-March. While the SEI bulls continue to show strength, the uptrend could prove premature as massive bearish sentiment hovers above the altcoin’s price.
US economy: Slower growth with stronger inflation

The US Dollar strengthened, and stocks fell after statistical data from the US. The focus was on the preliminary estimate of GDP for the first quarter. Annualised quarterly growth came in at just 1.6%, down from the 2.5% and 3.4% previously forecast.