Gold technical analysis: Gold ranges between 50 and 100 SMAs; momentum feeble

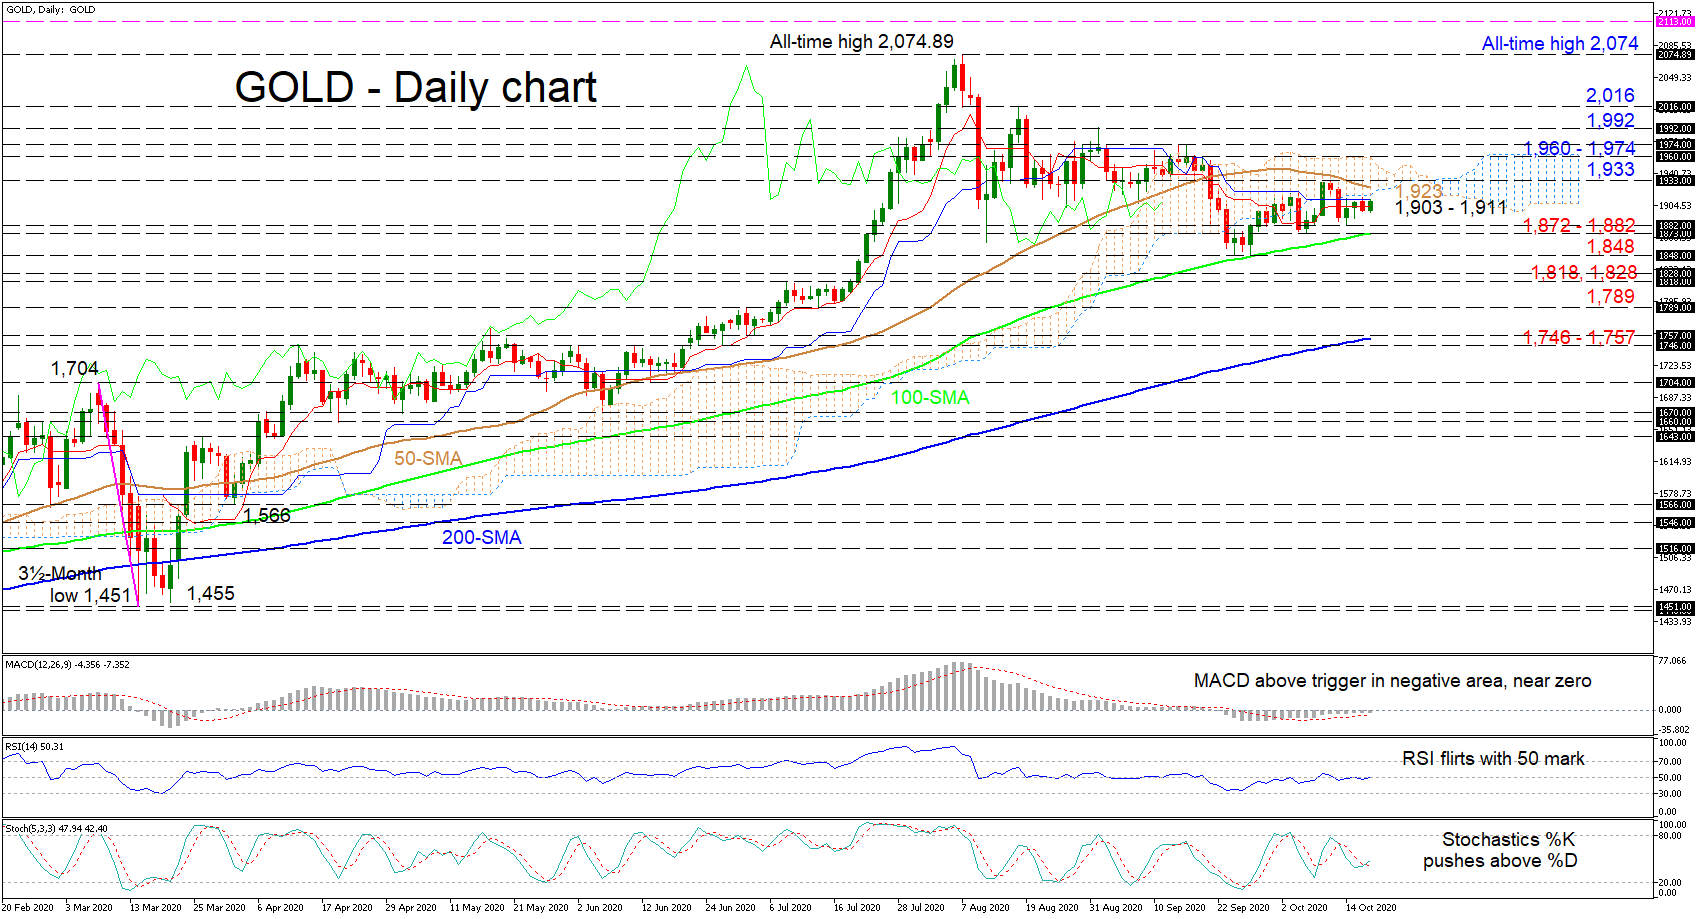
Gold seems to be adopting a sideways pattern after retreating under the Ichimoku cloud. The guiding and constricting 50- and 100-day simple moving averages (SMAs), as well as the horizontal Ichimoku lines, further back the suspended picture of the commodity.
The short-term oscillators suggest a frozen state of directional momentum. The MACD, in the negative region, is holding above its red signal line but slightly below its zero mark, while the RSI is zig zagging around its neutral threshold. A completed bullish overlap between the stochastic lines endorses the marginal improvement in the price. Nonetheless, the predominant bullish tone of the SMAs remains intact for now.
Pushing above the blue Kijun-sen line at 1,911 and the cloud’s lower surface, the slightly easing 50-day SMA at 1,923 and the 1,933 nearby high may provide initial limitations to upside moves. Overtaking these first constraints, the commodity may face a resistance section from 1,960 to 1,974, which also overlaps with the cloud’s upper boundary. Surpassing this zone, the 1,992 border from September 1 may draw traders’ attention before the 2,016 peak challenges the climb.
Otherwise, if selling interest increases pushing the price below the red Tenkan-sen line at 1,903, an early key support region of 1,872 - 1,882 including the 100-day SMA, could dismiss the decline. Slipping underneath, the price may encounter the crucial trough of 1,848, which if broken could send the price towards the 1,828 and 1,818 barriers. Should additional losses unfold, the precious metal could extend towards the 1,789 low ahead of the support zone of 1,746 - 1,757, currently encapsulating the 200-day SMA.
In brief, gold holds a neutral stance in the short-term picture confined between the 50- and 100-day SMAs. Yet, an initial break either above 1,933 or below 1,872 would be needed to trigger a direction.
Author

Anthony Charalambous joined XM in 2019 and specializes in preparing daily technical analysis, using his years of trading experience to provide detailed forecasting for all major asset classes such as forex, indices, commodities and equities.


