Gold Price News and Forecast: XAU/USD remains depressed below $1,780 level ahead of US GDP


Gold Price Forecast: XAU/USD eyeing a firm break above $1800, US GDP in focus

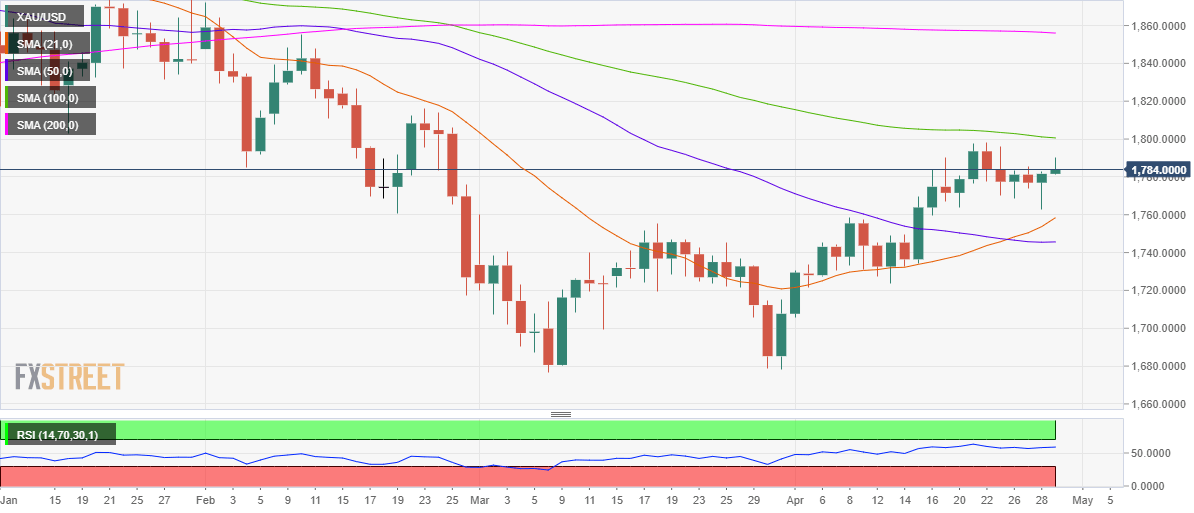
Gold (XAU/USD) extended its recovery from eight-day lows of $1763 and rallied as high as $1782 after the US dollar’s sell-off accelerated alongside the decline in the Treasury yields after the Federal Reserve (Fed) kept the monetary policy settings unchanged on Wednesday. It was the dismissal from Fed Chair Powell on tapering talks, which hammered the greenback across the board while the 10-year US rates fell from near 1.65% to 1.61%. While acknowledging improvement in the economic outlook, courtesy of the successful vaccination drives, Powell downplayed concerns over rising inflation, calling them transitory. Read more...

XAUUSD

Gold Price Analysis: XAU/USD remains depressed below $1,780 level ahead of US GDP

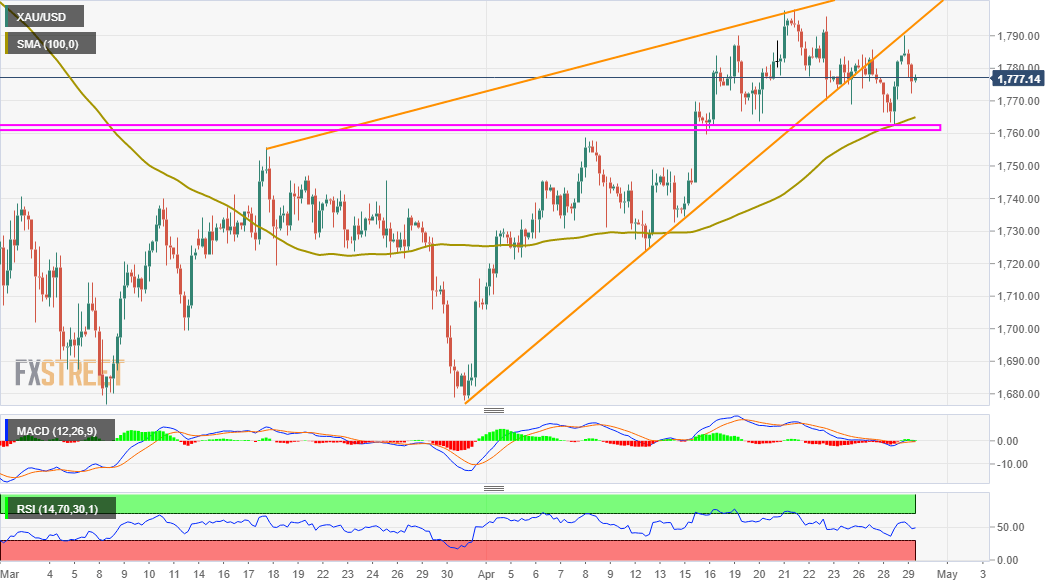
Gold continued losing ground through the mid-European session and dropped to fresh daily lows, around the $1,772 region in the last hour.

The precious metal struggled to capitalize on its early positive move, instead witnessed an intraday turnaround from one-week tops. The underlying bullish tone was seen as a key factor that acted as a headwind for the safe-haven XAU/USD. This, along with a strong pickup in the US Treasury bond yields, prompted some fresh selling around the non-yielding yellow metal. Read more...

xauusd

Gold Price Analysis: XAU/USD trades with modest losses below $1,780, US GDP awaited

Gold extended its steady descent through the early European session and refreshed daily lows, around the $1,775 area in the last hour.

The precious metal built on the previous day's goodish rebound from one-and-half-week lows and gained some traction during the first half of the trading action on Thursday. The US dollar added to the post-FOMC losses and dropped to over two-month lows. This, in turn, was seen as a key factor that provided a modest lift to the dollar-denominated commodity. Read more...

XAU/USD

Overview
Today last price 1775.88
Today Daily Change -5.71
Today Daily Change % -0.32
Today daily open 1781.59
 
Trends
Daily SMA20 1757.15
Daily SMA50 1745.45
Daily SMA100 1801.14
Daily SMA200 1856.44
 
Levels
Previous Daily High 1782.63
Previous Daily Low 1762.72
Previous Weekly High 1797.93
Previous Weekly Low 1763.7
Previous Monthly High 1759.98
Previous Monthly Low 1676.87
Daily Fibonacci 38.2% 1775.02
Daily Fibonacci 61.8% 1770.33
Daily Pivot Point S1 1768.66
Daily Pivot Point S2 1755.74
Daily Pivot Point S3 1748.75
Daily Pivot Point R1 1788.57
Daily Pivot Point R2 1795.56
Daily Pivot Point R3 1808.48


Share: Feed news

Information on these pages contains forward-looking statements that involve risks and uncertainties. Markets and instruments profiled on this page are for informational purposes only and should not in any way come across as a recommendation to buy or sell in these assets. You should do your own thorough research before making any investment decisions. FXStreet does not in any way guarantee that this information is free from mistakes, errors, or material misstatements. It also does not guarantee that this information is of a timely nature. Investing in Open Markets involves a great deal of risk, including the loss of all or a portion of your investment, as well as emotional distress. All risks, losses and costs associated with investing, including total loss of principal, are your responsibility. The views and opinions expressed in this article are those of the authors and do not necessarily reflect the official policy or position of FXStreet nor its advertisers. The author will not be held responsible for information that is found at the end of links posted on this page.

If not otherwise explicitly mentioned in the body of the article, at the time of writing, the author has no position in any stock mentioned in this article and no business relationship with any company mentioned. The author has not received compensation for writing this article, other than from FXStreet.

FXStreet and the author do not provide personalized recommendations. The author makes no representations as to the accuracy, completeness, or suitability of this information. FXStreet and the author will not be liable for any errors, omissions or any losses, injuries or damages arising from this information and its display or use. Errors and omissions excepted.

The author and FXStreet are not registered investment advisors and nothing in this article is intended to be investment advice.

Recommended content


Recommended content

Editors’ Picks

AUD/USD stays defensive near 0.6500 after Australian CPI data

AUD/USD stays defensive near 0.6500 after Australian CPI data

AUD/USD stays defensive near 0.6500 in Wednesday's Asian trading. The Aussie faces headwinds from softer Australian CPI inflation data for May, which fans RBA rate cut expectations. A pause in the US Dollar sell-off undermines the pair despite a better market mood. 

USD/JPY stalls the rebound below 145.00 after Japan's PPI, BoJ headlines

USD/JPY stalls the rebound below 145.00 after Japan's PPI, BoJ headlines

USD/JPY stalls the renewed upside below the 145.00 mark following the release of strong Japanese Services PPI, which supports the case for more BoJ rate hikes despite the mixed BoJ's June Summary of Opinions. Meanwhile, the US Dollar's downside consolidation phase also keeps the pair on the defensive. 

Gold price ticks higher toward $3,350 on weaker US Dollar

Gold price ticks higher toward $3,350 on weaker US Dollar

Gold price is looking to build on the previous day's bounce from sub-$3,300 levels, or over a two-week low, amid the prevalent US Dollar selling bias. However, Powell's hawkish tone could limit deeper USD losses. Furthermore, the Israel-Iran ceasefire optimism might cap the yellow metal.

Circle stock plunges 15%, analysts predict bearish pressure from key long-term headwinds

Circle stock plunges 15%, analysts predict bearish pressure from key long-term headwinds

Circle's CRCL fell to $222 on Tuesday, just a day after its surge to $292, nearly matching Coinbase's market cap. Several analysts predict that CRCL could see a reversal in the long term due to potential interest rate reductions and rising competition. CRCL’s market cap has declined to $54 billion.

Could Iran block the Strait of Hormuz? Why Oil is on edge after US strikes

Could Iran block the Strait of Hormuz? Why Oil is on edge after US strikes

As the Israel-Iran conflict reaches new heights, an old threat is coming back to haunt the markets: that of the closure of the Strait of Hormuz. This narrow arm of the sea in the Persian Gulf, wedged between Iran to the north and the United Arab Emirates and Oman to the south, is much more than a simple sea passage.

The Best brokers to trade EUR/USD

The Best brokers to trade EUR/USD

SPONSORED Discover the top brokers for trading EUR/USD in 2025. Our list features brokers with competitive spreads, fast execution, and powerful platforms. Whether you're a beginner or an expert, find the right partner to navigate the dynamic Forex market.

Forex MAJORS

Cryptocurrencies

Signatures

Best Brokers of 2025