Gold gains today, still ends week down over 3%
- Gold climbs 0.23% on Friday but is set for weekly drop above 3%.
- US Durable Goods Orders exceed expectations, though March's revised down data softened the impact.
- XAU/USD recovers on mixed US data that weighs on US Dollar.
- Traders now anticipate only 25 basis points of Fed rate cuts in 2024, reducing expectations for easing.

Gold price stabilized on Friday after registering back-to-back days of losses, climbing some 0.23%. Yet it was down more than 3% on the week, the largest weekly loss since December 2023. The US Durable Goods Orders data was better than expected, but a downward revision to the previous month's reading diminished the report’s impact, giving the green light to Gold buyers.
The XAU/USD trades at $2,332 after bouncing off a daily low of $2,325.
Gold traders had stepped in ahead of the weekend. US economic data on Thursday showed that US business activity picked up, decreasing the chances of seeing the Federal Reserve (Fed) cut rates. At the time of writing, fed funds rate futures estimate just 25 basis points of interest rate cuts in 2024.
Friday’s data did little to increase investors' optimism about loosening Fed policy. The US Department of Commerce revealed a goodish Durable Goods Orders report for April, but March’s downward revision weighed on the Greenback. That and the fall in US Treasury yields sponsored Gold’s recovery after hitting a low.
Meanwhile, the University of Michigan's (UoM) recent poll that measures consumer sentiment showed a slight improvement, yet inflation expectations were mixed.
The US 10-year Treasury note is yielding 4.461% and loses one-and-a-half basis points, undermining the Greenback. The US Dollar Index (DXY), which tracks the buck’s performance against a basket of peers, trades at 104.70, down 0.33%.
Daily digest market movers: Gold price climbs as the Greenback gets battered
- Gold prices are boosted by the decline in US Treasury yields, a softer US Dollar, and an improvement in risk appetite as Wall Street recovers some ground.
- April’s US Durable Goods Orders increased by 0.7% MoM, surpassing the estimated -0.8% contraction but lower than the downwardly revised figures of 0.8% for March.
- The University of Michigan Consumer Sentiment Index for May was 69.1, down from April’s 77.2 but above the forecast of 67.5. Inflation expectations for one year rose slightly to 3.3% from 3.2%, while five-year inflation expectations remained unchanged at 3%.
- S&P Global released the final US PMI readings for May. The Manufacturing PMI rose to 50.9, surpassing both estimates and April's figure of 50.0. The Services PMI significantly outperformed forecasts and April's 51.3, increasing to 54.8.
- FOMC Minutes showed that Fed officials remained uncertain about the degree of policy restrictiveness. They added that “it would take longer than previously anticipated to gain greater confidence in inflation moving sustainably to 2%.”
- Gold prices were underpinned by emerging markets' central bank buying, according to an article in The Wall Street Journal. The catalyst that sparked the buying was Western sanctions on Russia after its invasion of Ukraine.
- The World Gold Council revealed that central banks added around 2,200 tons of the golden metal since Q3 2022.
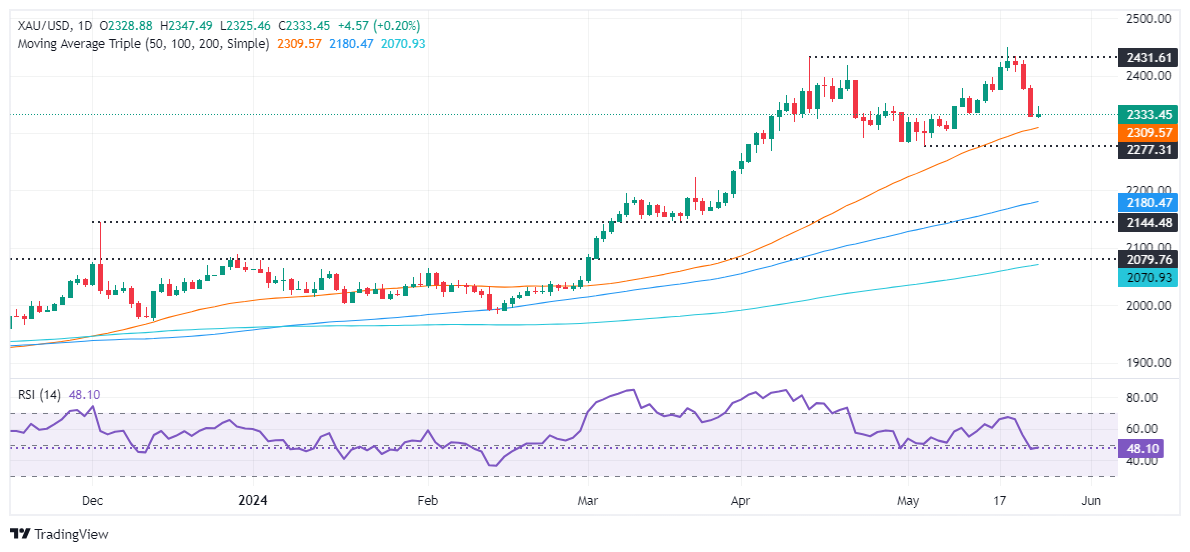
Technical analysis: Gold price clings to gains above $2,330
Gold’s uptrend remains in place despite retreating toward the $2,330 area. Even though the Relative Strength Index (RSI) turned bearish, it is at risk of surpassing the 50-midline, hinting that buyers are moving in.
Therefore, if XAU/USD climbs above $2,350, that would expose the $2,400 mark. Further gains lie overhead as buyers target the year-to-date high of $2,450, followed by the $2,500 mark.
Conversely, if bears remain in charge, they need to push the XAU/USD below the May 8 low of $2,303. Once surpassed, the May 3 cycle low of $2,277 would follow.
Gold FAQs
Gold has played a key role in human’s history as it has been widely used as a store of value and medium of exchange. Currently, apart from its shine and usage for jewelry, the precious metal is widely seen as a safe-haven asset, meaning that it is considered a good investment during turbulent times. Gold is also widely seen as a hedge against inflation and against depreciating currencies as it doesn’t rely on any specific issuer or government.
Central banks are the biggest Gold holders. In their aim to support their currencies in turbulent times, central banks tend to diversify their reserves and buy Gold to improve the perceived strength of the economy and the currency. High Gold reserves can be a source of trust for a country’s solvency. Central banks added 1,136 tonnes of Gold worth around $70 billion to their reserves in 2022, according to data from the World Gold Council. This is the highest yearly purchase since records began. Central banks from emerging economies such as China, India and Turkey are quickly increasing their Gold reserves.
Gold has an inverse correlation with the US Dollar and US Treasuries, which are both major reserve and safe-haven assets. When the Dollar depreciates, Gold tends to rise, enabling investors and central banks to diversify their assets in turbulent times. Gold is also inversely correlated with risk assets. A rally in the stock market tends to weaken Gold price, while sell-offs in riskier markets tend to favor the precious metal.
The price can move due to a wide range of factors. Geopolitical instability or fears of a deep recession can quickly make Gold price escalate due to its safe-haven status. As a yield-less asset, Gold tends to rise with lower interest rates, while higher cost of money usually weighs down on the yellow metal. Still, most moves depend on how the US Dollar (USD) behaves as the asset is priced in dollars (XAU/USD). A strong Dollar tends to keep the price of Gold controlled, whereas a weaker Dollar is likely to push Gold prices up.
US Dollar PRICE Today
The table below shows the percentage change of US Dollar (USD) against listed major currencies today. US Dollar was the strongest against the Japanese Yen.
| USD | EUR | GBP | JPY | CAD | AUD | NZD | CHF | |
|---|---|---|---|---|---|---|---|---|
| USD | -0.30% | -0.33% | 0.06% | -0.41% | -0.34% | -0.31% | 0.03% | |
| EUR | 0.30% | -0.02% | 0.31% | -0.13% | -0.04% | -0.01% | 0.32% | |
| GBP | 0.33% | 0.02% | 0.36% | -0.18% | 0.02% | 0.04% | 0.35% | |
| JPY | -0.06% | -0.31% | -0.36% | -0.49% | -0.37% | -0.39% | -0.01% | |
| CAD | 0.41% | 0.13% | 0.18% | 0.49% | 0.12% | 0.11% | 0.51% | |
| AUD | 0.34% | 0.04% | -0.02% | 0.37% | -0.12% | -0.02% | 0.33% | |
| NZD | 0.31% | 0.00% | -0.04% | 0.39% | -0.11% | 0.02% | 0.40% | |
| CHF | -0.03% | -0.32% | -0.35% | 0.00% | -0.51% | -0.33% | -0.40% |
The heat map shows percentage changes of major currencies against each other. The base currency is picked from the left column, while the quote currency is picked from the top row. For example, if you pick the US Dollar from the left column and move along the horizontal line to the Japanese Yen, the percentage change displayed in the box will represent USD (base)/JPY (quote).
Author

Christian Borjon Valencia
FXStreet
Markets analyst, news editor, and trading instructor with over 14 years of experience across FX, commodities, US equity indices, and global macro markets.


