Gold Price Forecast: XAU/USD remains pressured towards $1,800 amid firmer yields
- Gold prices struggle to keep the bounce off one-week low after surprise volatility.
- Market sentiment stays firmer despite a jump in covid infections.
- Yields rally on downbeat seven-year auction, US data came in weaker.
- Gold Price Forecast: Seesawing around 1,800 with a bearish tilt

Update: After a wild ride to the downside, gold price managed to yield a daily closing above the $1,800 mark on Wednesday, although bear retain control this Thursday amid firmer Treasury yields. The cautious market mood and a subdued US dollar index are helping put a floor under gold price.
Technically, the bright metal is clinging onto the 50-Daily Moving Average (DMA) amid an impending bull cross on the daily sticks. On the data front, the mid-tier US economic data came in mixed and failed to have much impact on the metal’s price. Traders now await the US weekly Jobless Claims data for fresh trading impetus. The year-end flows, however, will have a bigger role to play going forward.
End of update
Gold (XAU/USD) defends $1,800, taking rounds to $1,804-05, as traders approach Thursday’s Asian session. The yellow metal remained surprisingly volatile during the last session amid a rally in the US Treasury yields despite a jump in the global coronavirus cases.
US 10-year Treasury yields jumped the most in three weeks to refresh monthly high around 1.557%, up 7.6 basis points (bps) by the end of Wednesday’s North American session. The reason could be linked to a disappointment from the weak seven-year bond auction.
“The seven-year notes sold at a high yield of 1.48%, around two basis points higher than where they had traded before the auction,” said Reuters. The news also adds, “Seven-year note yields rose as high as 1.472%, the highest since Dec. 9. Benchmark 10-year yields reached 1.558%, the highest since Nov. 29., and 30-year yields reached 1.971%, the highest since Nov. 24.”
Despite the stronger bond yields, Wall Street managed to stop bears, with Dow Jones refreshing a record top during the six-day uptrend, before closing with mild gains of 0.25% on a day around 36,488. Further, S&P 500 rose 0.14% but Nasdaq had to bear the burden of higher yields, down 0.10% while printing two-day declines.
The firmer yields could also be linked to the recently strong expectations of the Fed’s sooner rate hikes in 2022. A jump in the US inflation expectations, as portrayed by 10-Year Breakeven Inflation Rate numbers from the Federal Reserve Bank of St. Louis (FRED) also back the Fed rate-hike woes. The inflation gauge refreshed the monthly top to 2.53% at the latest.
Elsewhere, daily covid cases kept rising but the hopes that the speedily spreading South African virus variant, namely Omicron, is less severe, keep market players at peace during the year-end holiday season. “Almost 900,000 cases were detected on average each day around the world between Dec. 22 and 28, with myriad countries posting new all-time highs in the previous 24 hours, including the United States, Australia, many in Europe and Bolivia,” said Reuters.
Talking about data, the US Pending Home Sales for November dropped below the forecast of +0.5% to -2.2% MoM whereas Good Trade Balance hit a record deficit of $-97.8B versus $-83.2B prior.
Amid these plays, gold buyers remain confused as the metal fails to keep the corrective pullback from the key DMA support. However, thin end-of-year liquidity conditions restrict any hope of clarity even as the aforementioned risk catalysts and US data are likely to offer intermediate moves.
Technical analysis
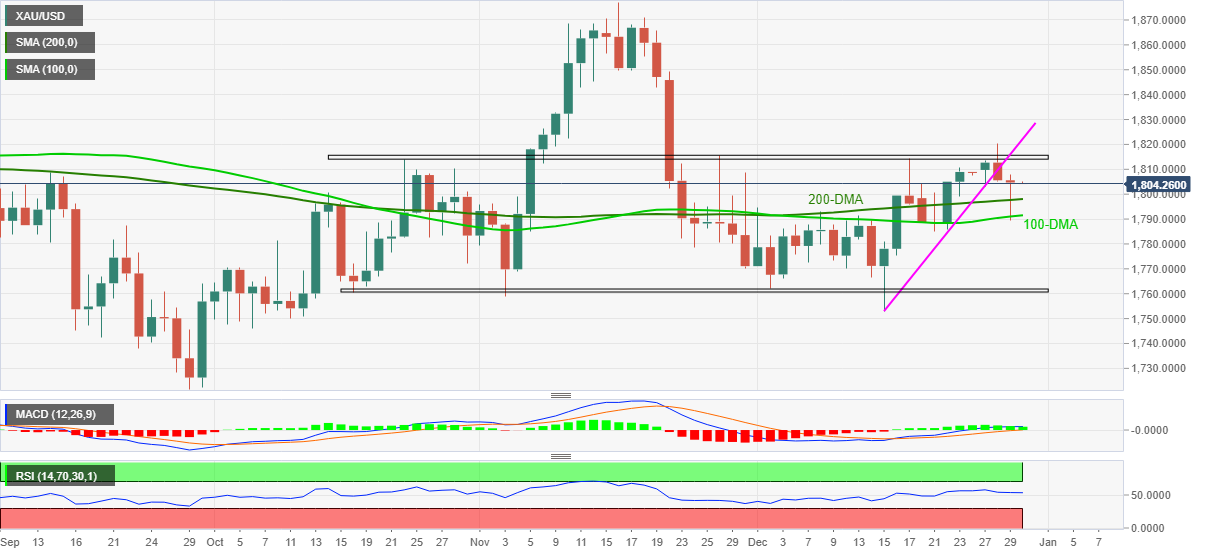
Despite bouncing off 100 and 200 DMAs, gold prices remain below a two-week-old ascending trend line, backed by a receding bullish bias of MACD and steady RSI.
Given the metal’s failures to bounce back beyond the previous support, not to forget multiple failures to cross the horizontal area from late October, gold bears are likely to keep the controls.
Even so, the 200 and 100 DMA levels, respectively around $1,798 and $1,791 challenge the metals further downside.
Following that, $1,772 may offer an intermediate halt before directing gold prices towards a support zone comprising multiple lows marked since October 18, close to $1,762-60.
Meanwhile, a daily closing beyond the aforementioned horizontal resistance around $1,814 will need validation from the previous support line, currently near $1,822, to recall the gold buyers.
Gold: Daily chart
Trend: Further weakness expected
Author

Anil Panchal
FXStreet
Anil Panchal has nearly 15 years of experience in tracking financial markets. With a keen interest in macroeconomics, Anil aptly tracks global news/updates and stays well-informed about the global financial moves and their implications.


