Gold Price Forecast: XAU/USD tumbles on central bank hikes, strong US NFP report
- XAU/USD plunges, shedding 1.68% as rate hikes and soaring bond yields dull gold’s allure.
- US Nonfarm Payrolls beat estimates with 253K new jobs, pushing Treasury bond yields higher.
- Gold demand dips in Q1 2023, with the central bank and Chinese consumer purchases offset by investor buying.

Gold price slides sharply as the XAU/USD failed to hold to its gains nearby the year-to-date (YTD) high at $2081.46, as two major central banks increased rates, boosting bond yields. Additionally, a better-than-expected jobs report in the United States (US), triggered a jump on US T-bond yields. At the time of writing, the XAU/USD is trading at $2015.51, below its opening price by 1.68%.
Gold’s rally dented by US data, lower demand
US equities continued to recover some ground after the US banking turmoil dented mood. The US Department of Labor revealed the April US Nonfarm Payrolls, which showed that the labor market remains tight, with the economy adding 253K jobs, crushing forecasts of 180K. Additionally, the report revealed that wages are increasing, as shown by the Average Hourly Earnings jumping 0.5% MoM, above the 0.3% forecasts, while the Unemployment Rate continued to slump past 3.5%, at 3.4%.
XAU/USD plunged on the US jobs data release, from around $2038 to $2007, but later pierced below the $2000 figure, hitting a three-day low of $1999.57. This resulted from short-term futures traders pairing Federal Reserve (Fed) rate cuts, as could be seen in US Treasury bond yields, which are skyrocketing, following the NFP report.
Must read: Breaking: US Nonfarm Payrolls rise by 253,000 in April vs. 179,000 expected
The US 2 and 10-year Treasury notes are climbing sharply 19 and 9 basis points each, yielding 3.924% and 3.443%, respectively. Despite the previously mentioned, the greenback remains downward pressured, registering modest losses.
The US Dollar Index (DXY) measures the performance of six currencies vs. the greenback, dropping 0.15%, down to 101.25.
Of late, St. Louis Federal Reserve President James Bullard commented that a soft landing is possible, adding that the labor report was “impressive.” Bullard said he’s open-minded about raising or holding rates at the FOMC’s next meeting in June, as he joined the “data-dependant” posture. Nonetheless, Bullard feels that rates need to “grind higher.”
Another reason that weighed on XAU/USD’s prices is that global demand for Gold fell during the first quarter of 2023, as large purchases made by central banks and Chinese consumers were offset by investors buying, as reported by the World Gold Consortium (WGC).
Upcoming events
The calendar is pretty much light, with the Fed Governor Lisa Cook pending to cross newswires.
XAU/USD Daily Chart
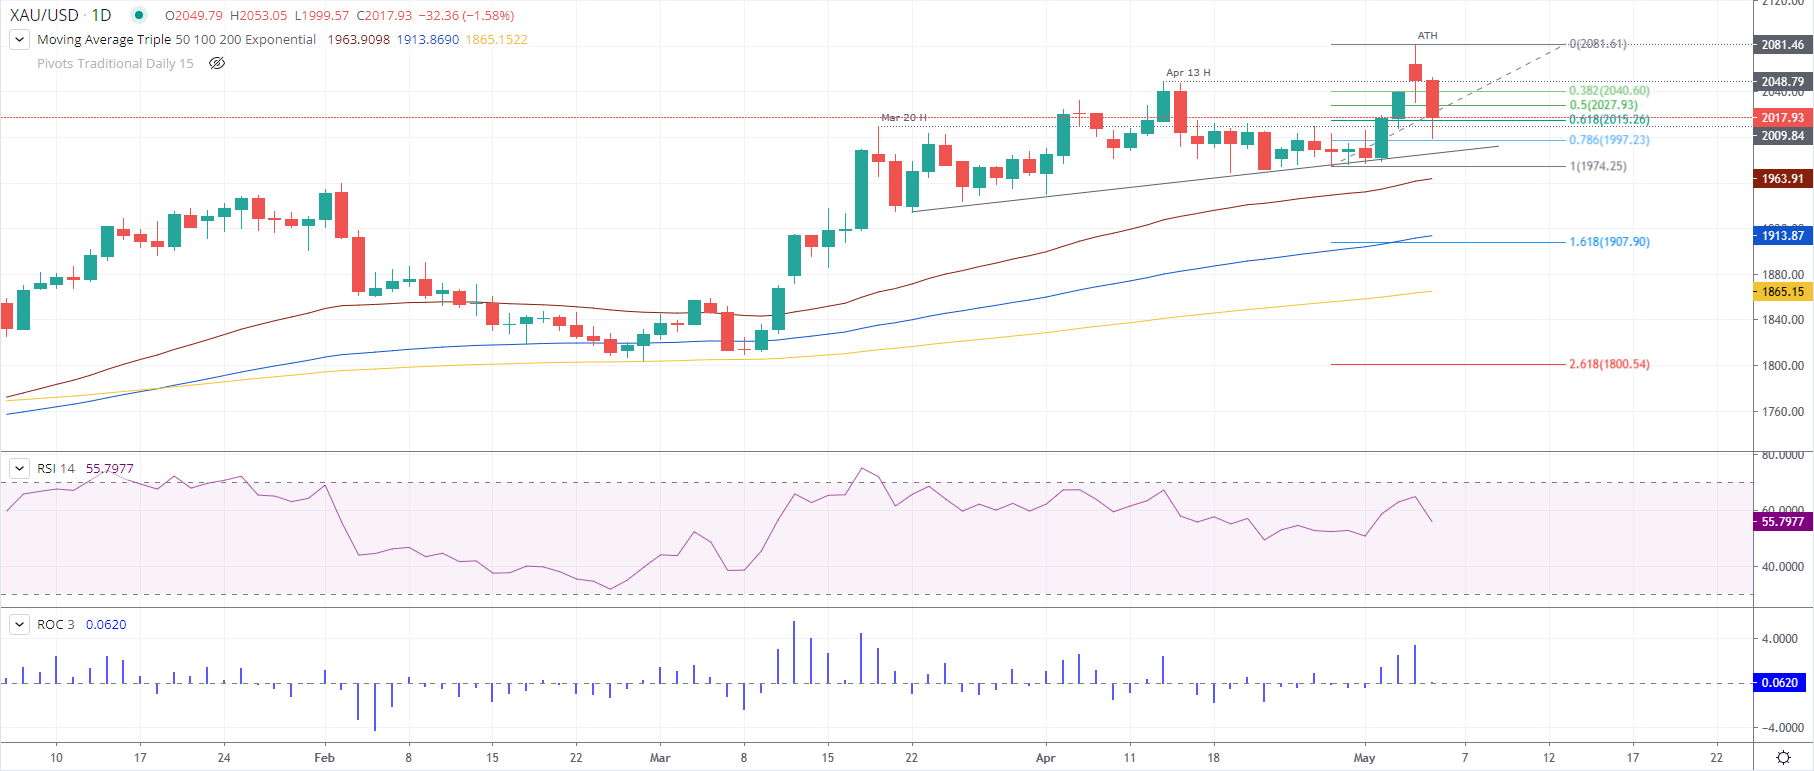
After hitting a new ATH, XAU/USD retreated below the 61.8% Fibonacci retracement and was $2 shy of hitting the 78.6% Fibonacci level. Nevertheless, Gold bounced from its daily low of $1999.57, above the 61.8% Fibonacci retracement at $2015.26. Notably, the Relative Strength Index (RSI) indicator remains in bullish territory, although it’s moving down. The 3-day Rate of Change (RoC) turned neutral in a possible sign of buyers booking profits ahead of the weekend.
For a bullish continuation, XAU/USD buyers must reclaim the 50% Fibonacci level at $2028. Break above will expose the 38.2% Fib retracement at $2040.60 before clearing the path toward the ATH. Conversely, a fall below $2000 would expose a one-month-old support trendline that passes around the $1970-80 area.
Author

Christian Borjon Valencia
FXStreet
Markets analyst, news editor, and trading instructor with over 14 years of experience across FX, commodities, US equity indices, and global macro markets.


