|

Gold Price Forecast: XAU/USD trades mildly lower and closes a losing week after US PCE figures

  • The XAU/USD experiences a slight decrease, holding slightly above $2,018 with a minor pullback.
  • Key indicators such as RSI and MACD demonstrate a subdued buying momentum, as bulls consolidate December’s rally.

On Friday's session, the XAU/USD was seen trading at $2,018, presenting a slight decline of 0.08% and closing a 0.55% weekly loss. After reaching a level of $2,135 in December, buyers have been largely taking a pause, suggesting a neutral to a bullish outlook on the daily chart. Despite some momentum observed in the four-hour chart, the indicators remain relatively weak.

In addition, the USD recovery fueled by markets adjusting their bets on the Federal Reserve (Fed) due to the US economy showing resilience is pushing the metal lower. On Friday, soft Personal Consumption Expenditures (PCE) figures from December from the US didn’t fuel a significant reaction to the market expectations on the Fed which meets next week. As for now, markets pushed the start of the easing cycle to May from March but the Fed's tone may change those expectations.

XAU/USD levels to watch

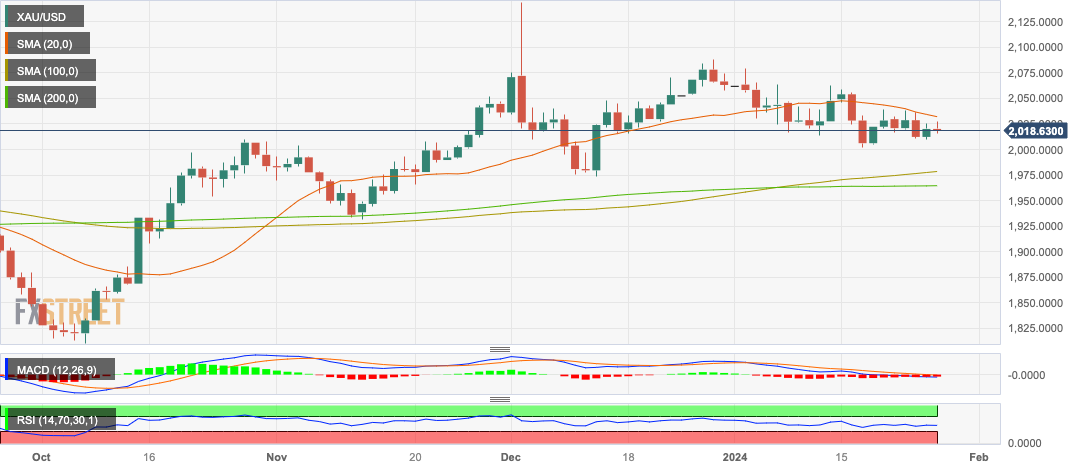
The technical indicators on the daily chart, specifically the Relative Strength Index (RSI) and the position of the metal regarding its 20, 100, and 200 Simple Moving Averages (SMAs) paint a diverse picture. Despite the RSI showing a negative slope and currently residing in negative territory, the price manages to stay above the 20, 100, and 200-day SMAs. This is indicative of bullish standing in the broader time frame, and the recent pullback could be explained by the bulls taking a breather after pushing the price to a high of $2,135 in December.

Drilling down to the narrower four-hour chart, the momentum indicators present weak yet existent bullish undertones. The four-hour RSI shows a negative slope but is currently in positive territory, while the four-hour Moving Average Convergence Divergence (MACD) continues to produce flat red bars, again suggesting a hold on bearish momentum.

XAU/USD

Overview
Today last price2018.63
Today Daily Change-1.53
Today Daily Change %-0.08
Today daily open2020.16
 
Trends
Daily SMA202034.39
Daily SMA502028.83
Daily SMA1001977.49
Daily SMA2001964.39
 
Levels
Previous Daily High2025.39
Previous Daily Low2009.65
Previous Weekly High2058.67
Previous Weekly Low2001.9
Previous Monthly High2144.48
Previous Monthly Low1973.13
Daily Fibonacci 38.2%2019.38
Daily Fibonacci 61.8%2015.66
Daily Pivot Point S12011.41
Daily Pivot Point S22002.66
Daily Pivot Point S31995.67
Daily Pivot Point R12027.15
Daily Pivot Point R22034.14
Daily Pivot Point R32042.89

XAU/USD daily chart

Author

Patricio Martín

Patricio is an economist from Argentina passionate about global finance and understanding the daily movements of the markets.

More from Patricio Martín
Share:

Markets move fast. We move first.

Orange Juice Newsletter brings you expert driven insights - not headlines. Every day on your inbox.

By subscribing you agree to our Terms and conditions.

Editor's Picks

EUR/USD moves sideways below 1.1800 on Christmas Eve

EUR/USD struggles to find direction and trades in a narrow channel below 1.1800 after posting gains for two consecutive days. Bond and stock markets in the US will open at the usual time and close early on Christmas Eve, allowing the trading action to remain subdued. 

GBP/USD keeps range around 1.3500 amid quiet markets

GBP/USD keeps its range trade intact at around 1.3500 on Wednesday. The Pound Sterling holds the upper hand over the US Dollar amid pre-Christmas light trading as traders move to the sidelines heading into the holiday season. 

Gold retreats from record highs, trades below $4,500

Gold retreats after setting a new record-high above $4,520 earlier in the day and trades in a tight range below $4,500 as trading volumes thin out ahead of the Christmas break. The US Dollar selling bias remains unabated on the back of dovish Fed expectations, which continues to act as a tailwind for the bullion amid persistent geopolitical risks.

Bitcoin slips below $87,000 as ETF outflows intensify, whale participation declines

Bitcoin price continues to trade around $86,770 on Wednesday, after failing to break above the $90,000 resistance. US-listed spot ETFs record an outflow of $188.64 million on Tuesday, marking the fourth consecutive day of withdrawals.

Economic outlook 2026-2027 in advanced countries: Solidity test

After a year marked by global economic resilience and ending on a note of optimism, 2026 looks promising and could be a year of solid economic performance. In our baseline scenario, we expect most of the supportive factors at work in 2025 to continue to play a role in 2026.

Avalanche struggles near $12 as Grayscale files updated form for ETF

Avalanche trades close to $12 by press time on Wednesday, extending the nearly 2% drop from the previous day. Grayscale filed an updated form to convert its Avalanche-focused Trust into an ETF with the US Securities and Exchange Commission.