Gold Price Forecast: XAU/USD to remain choppy below $1,800 ahead of US inflation – Confluence Detector
- Gold price returns to the red on Thursday amid sell-on-rallies trading.
- US Treasury yields trade firmer above 1.50%, lifting the dollar’s demand.
- Gold sellers eye $1,750 as Fed stays on tightening path.

Gold price is correcting from weekly tops, as global stocks and Treasury yields rebound on easing Omicron fears. Further, hopes that the Fed will likely accelerate the reduction in bond-buying next week add to the pullback in gold price. However, expectations of hot US inflation and rising Chinese Consumer Price Index (CPI) could likely limit the decline in gold price. Markets also remain cautious ahead of Thursday’s Treasury note auction and incoming Omicron updates worldwide.
Read: Gold Price Forecast: Sellers happily adding on spikes amid a lack of clear direction
Gold Price: Key levels to watch
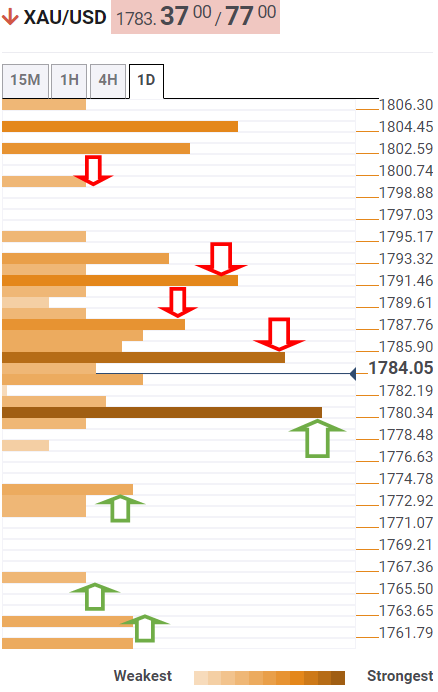
The Technical Confluences Detector shows that the gold price is heading towards powerful support at $1,780, where the previous day’s low, pivot point one-day S1 and Fibonacci 38.2% one-week converge.
A sustained move below the latter could trigger a drop towards $1,773-$1,772, the intersection of the Fibonacci 23.6% one-week, pivot point one-day S2 and the Fibonacci 161.8% one-day.
The further downside could challenge the bullish commitments at the pivot point one-day S3 at $1,766, below which floors will open up towards the previous week’s low of $1,762.
On the flip side, gold bulls need to break through a dense cluster of healthy resistance levels around $1,786. That price zone is the confluence of the Fibonacci 23.6% one-month, Fibonacci 61.8% one-day and SMA10 four-hour.
The next relevant upside barrier is seen at $1,792, the meeting point of the Fibonacci 61.8% one-week, SMAs 100 and 200 one-day.
The SMA50 one-day at $1,796 will then challenge the bullish attempts, above which a rally towards $1,800 cannot be ruled out. That is the pivot point one-day R2.
Here is how it looks on the tool
About Technical Confluences Detector
The TCD (Technical Confluences Detector) is a tool to locate and point out those price levels where there is a congestion of indicators, moving averages, Fibonacci levels, Pivot Points, etc. If you are a short-term trader, you will find entry points for counter-trend strategies and hunt a few points at a time. If you are a medium-to-long-term trader, this tool will allow you to know in advance the price levels where a medium-to-long-term trend may stop and rest, where to unwind positions, or where to increase your position size.
Author

Dhwani Mehta
FXStreet
Residing in Mumbai (India), Dhwani is a Senior Analyst and Manager of the Asian session at FXStreet. She has over 10 years of experience in analyzing and covering the global financial markets, with specialization in Forex and commodities markets.


