Gold Price Forecast: XAU/USD stays on bear’s radar below $1,834 – Confluence Detector
- Gold remains sidelined between the key levels, inflation/growth fears keep sellers hopeful.
- Risk appetite improves on China’s covid updates, Fedspeak amid sluggish session.
- Multiple hurdles to the north challenge gold buyers, downside appears more lucrative.

Gold Price treads water for the second consecutive day, taking rounds to $1,815, as market sentiment dwindles amid a lack of major data/events and mixed signals. The precious metal faced rejection at $1,836 earlier in the week but buyers returned from $1,807 to nullify the moves, portraying lackluster moves of late.
The bullion’s inaction could be linked to the market’s confusion as gold (XAU/USD) is perceived as hedge-against-inflation but the fears of economic growth being dampened and repeated calls for the major central bank’s faster rate hikes seems to weigh on the metal prices. The latest positive for gold prices could be linked to improvement in China’s covid conditions and softer US data relating to housing. Moving on, an absence of major data/events keeps the gold price at the mercy of the US dollar moves, which in turn highlights risk catalysts and the scheduled second-tier data for fresh impulse.
Also read: Gold Price Forecast: XAU/USD trades lackluster despite gloomy market mood, DXY below 104.00
Gold Price: Key levels to watch
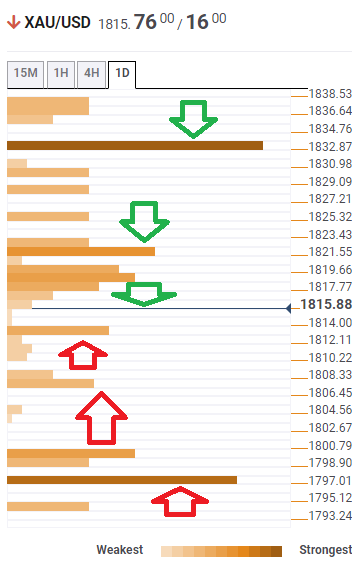
The Technical Confluences Detector shows that the Gold Price stays between the $35 range above $1,800, nearing multiple resistances starting from $1,817 that encompasses the SMA5 four-hour, Fibonacci 23.6% one-week and one-day.
Following that, a convergence of the SMA100 one-hour, the SMA10 four-hour and the Fibonacci 38.2% one-day challenge XAU/USD buyers around $1,821.
In a case where gold buyers cross $1,821, SMA5 one-day and Fibonacci 61.8% one-day at $1,825 and $1,828 respectively, can test upside momentum before the key $1,834 level including Fibonacci 38.2% one-week.
Alternatively, the previous day’s low near $1,813 tests short-term sellers ahead of directing them to $1,807, encompassing one-day S1 and the previous low four-hour.
Further down, the previous week’s low at $1,799 and pivot point one-month S2 at $1,797 will be crucial to watch for gold sellers.
Here is how it looks on the tool
About Technical Confluences Detector
The TCD (Technical Confluences Detector) is a tool to locate and point out those price levels where there is a congestion of indicators, moving averages, Fibonacci levels, Pivot Points, etc. If you are a short-term trader, you will find entry points for counter-trend strategies and hunt a few points at a time. If you are a medium-to-long-term trader, this tool will allow you to know in advance the price levels where a medium-to-long-term trend may stop and rest, where to unwind positions, or where to increase your position size.
Author

Anil Panchal
FXStreet
Anil Panchal has nearly 15 years of experience in tracking financial markets. With a keen interest in macroeconomics, Anil aptly tracks global news/updates and stays well-informed about the global financial moves and their implications.














