Gold Price Forecast: XAU/USD stays inside bearish channel below $1,700, Fed in focus


  • Gold price floats above 29-month low flashed on Friday as the Fed week begins.
  • US data favors traders to price-in 75 bps Fed rate hike.
  • Yields dribble around multi-day top, stocks remain pressured but DXY stays on the bull’s radar.
  • Off in Japan, the UK will join a light calendar at home to restrict intraday moves.

Gold price (XAU/USD) remains steady at around $1,675 as Asian traders begin the key week comprising the monetary policy meeting of the Fed.

The yellow metal refreshed the multi-month low the previous day amid broad US dollar strength, as well as increasingly hawkish calls of the US central bank’s next move, before bouncing off $1,654. The recovery moves, however, remain elusive amid a light calendar for the day and the market’s anxiety ahead of Wednesday’s Federal Open Market Committee (FOMC) meeting.

On Friday, the University of Michigan's preliminary readings of Consumer Sentiment for September came in at 59.5, up from 58.6 in the prior month while easing below 60.0 market forecasts. With the firmer US data, the odds of the Fed’s 75 basis points rate hike (bps) rose to nearly 80%, around 82% by the press time, while the market’s expectations of a full one percentage increase in the Fed rate rose to 18%.

It should be noted that a jump in China’s Treasury buying and the fears emanating from Beijing, as well as from Europe, also underpinned the US dollar’s safe-haven demand, which in turn weighed on the XAU/USD prices. That said, the US Dollar Index (DXY) dribbled around the 20-year high marked earlier in the month after the firmer data and geopolitical chatters.

Additionally, hawkish comments from the European Central Bank (ECB) policymakers could also be considered to favor the gold price. “The European Central Bank (ECB) could raise interest rates into next year, causing pain for consumers as it tries to depress demand that is now increasingly adding to sky-high inflation,” ECB Chief Economist Philip Lane said on Saturday per Reuters. On the same line was a ECB Governing Council member and German central bank head Joachim Nagel who said, “ECB rates are far away from levels that are suitable for inflation.”

Amid these plays, Wall Street benchmarks closed in the red while the US Treasury yields remained firmer, which in turn favored the market’s risk-off mood and exerted downside pressure on the metal prices.

Moving on, the XAU/USD traders will keenly await the Fed’s verdict and are likely to favor USD bulls amid hawkish hopes. However, the dot-plot, economic projections and Fed Chair Powell’s speech will be crucial for clear directions.

Technical analysis

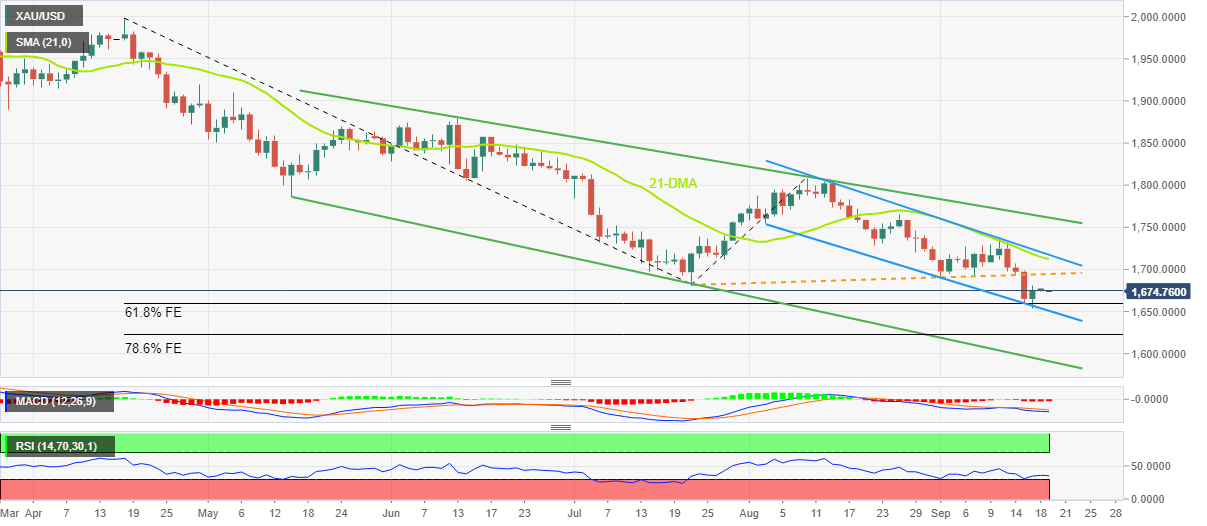
Gold price defends the bounce off a six-week-old descending trend channel’s support line, as well as the 61.8% Fibonacci Expansion (FE) of April-August moves. In doing so, the XAU/USD also justifies the RSI (14) bounce off the oversold territory.

However, the bearish MACD signals and sustained trading beyond the previous support line from late July, now resistance around $1,694, keep gold sellers hopeful.

Even if the quote crosses the $1,694 hurdle, the 21-DMA and upper line of the stated channel, respectively around $1,711 and $1,718, could challenge the metal’s recovery moves. It should be noted that a downward sloping resistance line from June 13, close to $1,762, appears the last defense of the bears.

Alternatively, the 61.8% FE and the aforementioned channel’s bottom, respectively near $1,694 and $1,650, are likely to restrict the short-term XAU/USD downside.

Following that, the 78.6% FE level and a four-month-old descending trend line, close to $1,622 and $1,590 in that order.

Overall, gold is likely to remain bearish but the downside room appears limited, at least for intraday.

Gold: Daily chart

Trend: Limited downside expected

Additional important levels

Overview
Today last price 1676.98
Today Daily Change 2.22
Today Daily Change % 0.13%
Today daily open 1674.76
 
Trends
Daily SMA20 1716.79
Daily SMA50 1737.26
Daily SMA100 1785.5
Daily SMA200 1831.32
 
Levels
Previous Daily High 1680.39
Previous Daily Low 1654.17
Previous Weekly High 1735.17
Previous Weekly Low 1654.17
Previous Monthly High 1807.93
Previous Monthly Low 1709.68
Daily Fibonacci 38.2% 1670.37
Daily Fibonacci 61.8% 1664.19
Daily Pivot Point S1 1659.16
Daily Pivot Point S2 1643.55
Daily Pivot Point S3 1632.94
Daily Pivot Point R1 1685.38
Daily Pivot Point R2 1695.99
Daily Pivot Point R3 1711.6


Share: Feed news

Information on these pages contains forward-looking statements that involve risks and uncertainties. Markets and instruments profiled on this page are for informational purposes only and should not in any way come across as a recommendation to buy or sell in these assets. You should do your own thorough research before making any investment decisions. FXStreet does not in any way guarantee that this information is free from mistakes, errors, or material misstatements. It also does not guarantee that this information is of a timely nature. Investing in Open Markets involves a great deal of risk, including the loss of all or a portion of your investment, as well as emotional distress. All risks, losses and costs associated with investing, including total loss of principal, are your responsibility. The views and opinions expressed in this article are those of the authors and do not necessarily reflect the official policy or position of FXStreet nor its advertisers. The author will not be held responsible for information that is found at the end of links posted on this page.

If not otherwise explicitly mentioned in the body of the article, at the time of writing, the author has no position in any stock mentioned in this article and no business relationship with any company mentioned. The author has not received compensation for writing this article, other than from FXStreet.

FXStreet and the author do not provide personalized recommendations. The author makes no representations as to the accuracy, completeness, or suitability of this information. FXStreet and the author will not be liable for any errors, omissions or any losses, injuries or damages arising from this information and its display or use. Errors and omissions excepted.

The author and FXStreet are not registered investment advisors and nothing in this article is intended to be investment advice.

Recommended content


Recommended content

Editors’ Picks

EUR/USD holds below 1.0750 ahead of key US data

EUR/USD holds below 1.0750 ahead of key US data

EUR/USD trades in a tight range below 1.0750 in the European session on Friday. The US Dollar struggles to gather strength ahead of key PCE Price Index data, the Fed's preferred gauge of inflation, and helps the pair hold its ground. 

EUR/USD News

GBP/USD consolidates above 1.2500, eyes on US PCE data

GBP/USD consolidates above 1.2500, eyes on US PCE data

GBP/USD fluctuates at around 1.2500 in the European session on Friday following the three-day rebound. The PCE inflation data for March will be watched closely by market participants later in the day.

GBP/USD News

Gold clings to modest daily gains at around $2,350

Gold clings to modest daily gains at around $2,350

Gold stays in positive territory at around $2,350 after closing in positive territory on Thursday. The benchmark 10-year US Treasury bond yield edges lower ahead of US PCE Price Index data, allowing XAU/USD to stretch higher.

Gold News

Bitcoin Weekly Forecast: BTC’s next breakout could propel it to $80,000 Premium

Bitcoin Weekly Forecast: BTC’s next breakout could propel it to $80,000

Bitcoin’s recent price consolidation could be nearing its end as technical indicators and on-chain metrics suggest a potential upward breakout. However, this move would not be straightforward and could punish impatient investors. 

Read more

US core PCE inflation set to signal firm price pressures as markets delay Federal Reserve rate cut bets

US core PCE inflation set to signal firm price pressures as markets delay Federal Reserve rate cut bets

The core PCE Price Index, which excludes volatile food and energy prices, is seen as the more influential measure of inflation in terms of Fed positioning. The index is forecast to rise 0.3% on a monthly basis in March, matching February’s increase. 

Read more

Forex MAJORS

Cryptocurrencies

Signatures