Gold Price Forecast: XAU/USD breaks higher towards $1,920, Ukraine updates eyed
- Gold begins March with mild losses after the biggest monthly jump since May.
- Markets await key trigger on Ukraine-Russia standoff after peace talks ended without any conclusion.
- Yields favor USD but Biden’s SOTU, Powell’s Testimony and US NFP will be a crucial catalyst.
- Gold Price Forecast: XAU/USD defends critical support line as Russia-Ukraine war flags growth risks.

Update: Gold is breaking higher once again above $1,900, having found strong buyers earlier in the Asian session. A sense of calm prevails on the Russia-Ukraine conflict front, compelling US dollar bulls to give up their control while lifting the bright metal. Although it remains to be seen if the metal sustains the renewed upside, as the US Treasury yields hold firmer across the curve amid a potential 25-bps March Fed rate hike due on the cards. Markets also look forward to the US ISM Manufacturing PMI slated for release later on Tuesday while the developments surrounding the Ukraine crisis will likely remain the main market driver. The focus also remains on US President Joe Biden’s State of the Union speech due early Wednesday.
Read: Biden SOTU later today
Gold (XAU/USD) pares daily losses around $1,906 heading into Tuesday’s European session. The bullion rose the most on a monthly basis since May 2021 by closing around $1,910 the previous day.
While the Russia-Ukraine story underpins the metal’s safe-haven demand, the recent rebound of the US dollar seems to have tested the XAU/USD bulls of late.
That said, the US Dollar Index (DXY) rise 0.13% intraday to 96.84 at the latest. In doing so, the greenback gauge benefits from the US Treasury yields, up two basis points (bps) to 1.856%. Also favoring the greenback bulls is the anxiety over the next move of Russia as it has already bombarded civilian buildings while the peace talks are still not off the table.
Elsewhere, upbeat US inflation expectations battle the recently softer Fedspeak to test the DXY bulls. The 10-year breakeven inflation rate per the St. Louis Federal Reserve (FRED) data jumped to the highest since November 23, marked a 2.62% figure by the end of Monday’s North American session. It should be noted that the CME’s FedWatch Tool marked nearly 5.0% probabilities of a 0.50% Fed rate hike in March, versus more than 50% before a few days. While considering this, Atlanta Fed President Raphael Bostic said on Monday, “Today I am in favor of a 25 bps move at March meeting."
Amid these plays, the stock futures remain sidelined whereas the Asia-Pacific equities also trade mixed by the press time.
Given the market’s indecision, each incoming headline will be closely observed for fresh directions. Among them, geopolitical and inflation-linked news will be more important. Also crucial will be the US ISM Manufacturing PMI for February and US President Joe Biden’s State Of The Union (SOTU) speech.
Technical analysis
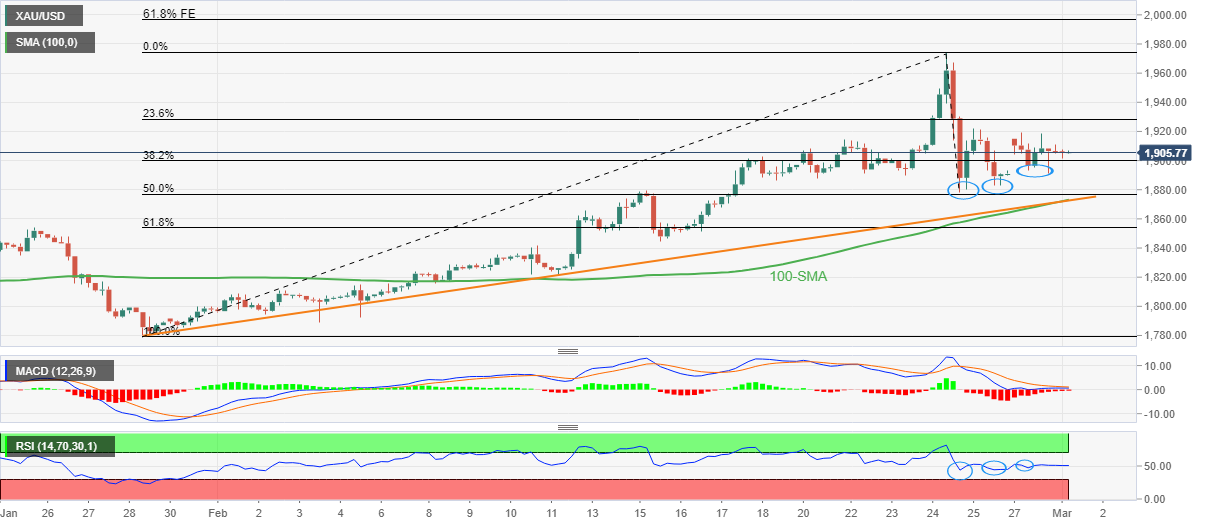
Having started the week on a positive note, gold prices remain sluggish around June 2021 peak.
However, the bullish RSI divergence, portrayed as recently higher lows of gold prices accompanies higher bottoms of the RSI line. Also on the positive side is the receding bearish bias of the MACD line.
That said, the metal is currently on the way to the 23.6% Fibonacci retracement (Fibo.) of late January-February upside, near $1,930. However, the gold buyers may struggle to overcome $1,930 but can propel the prices to February’s high around $1,975 on a successful breakout.
In a case where gold buyers manage to keep the reins past the $1,975 hurdle, the 61.8% Fibonacci Expansion (FE) of the stated move, around $1,997, as well as the $2,000 threshold, will be tough nuts to crack for the XAU/USD bulls.
On the contrary, pullback moves remain elusive until breaking $1,869 support convergence, comprising the 100-SMA and an upward sloping trend line from January 28.
It’s worth noting that gold’s weakness below $1,869 will aim for mid-February’s swing low near $1,845 before highlighting the $1,800 threshold for the XAU/USD bears.
Gold: Four-hour chart
Trend: Recovery expected
Author

Anil Panchal
FXStreet
Anil Panchal has nearly 15 years of experience in tracking financial markets. With a keen interest in macroeconomics, Anil aptly tracks global news/updates and stays well-informed about the global financial moves and their implications.


