Gold Price Forecast: XAU/USD bulls seeking correction above $1,800 but $1,790 beckons
- Gold remains pressured after the biggest daily fall in six weeks.
- US T-Bond Yields rallied to multi-day high as virus cases rally, Fed rate-hike concerns gain momentum.
- US ISM Manufacturing PMI can offer immediate direction, FOMC Minutes, NFP will be the key.
- Gold Price Forecast: Defying the 1,800 threshold on dollar’s demand

Update: Gold (XAU/USD) is attempting to recover losses made at the start of the New Year and trades some 0.25% higher in the Asia session at $1,805.76 within a tight $5.00 range so far. The focus is, however, on the downside while below $1,830 from a technical perspective. A break of $1,800 opens the risk of a downside continuation and the first test will be near to $1,790:
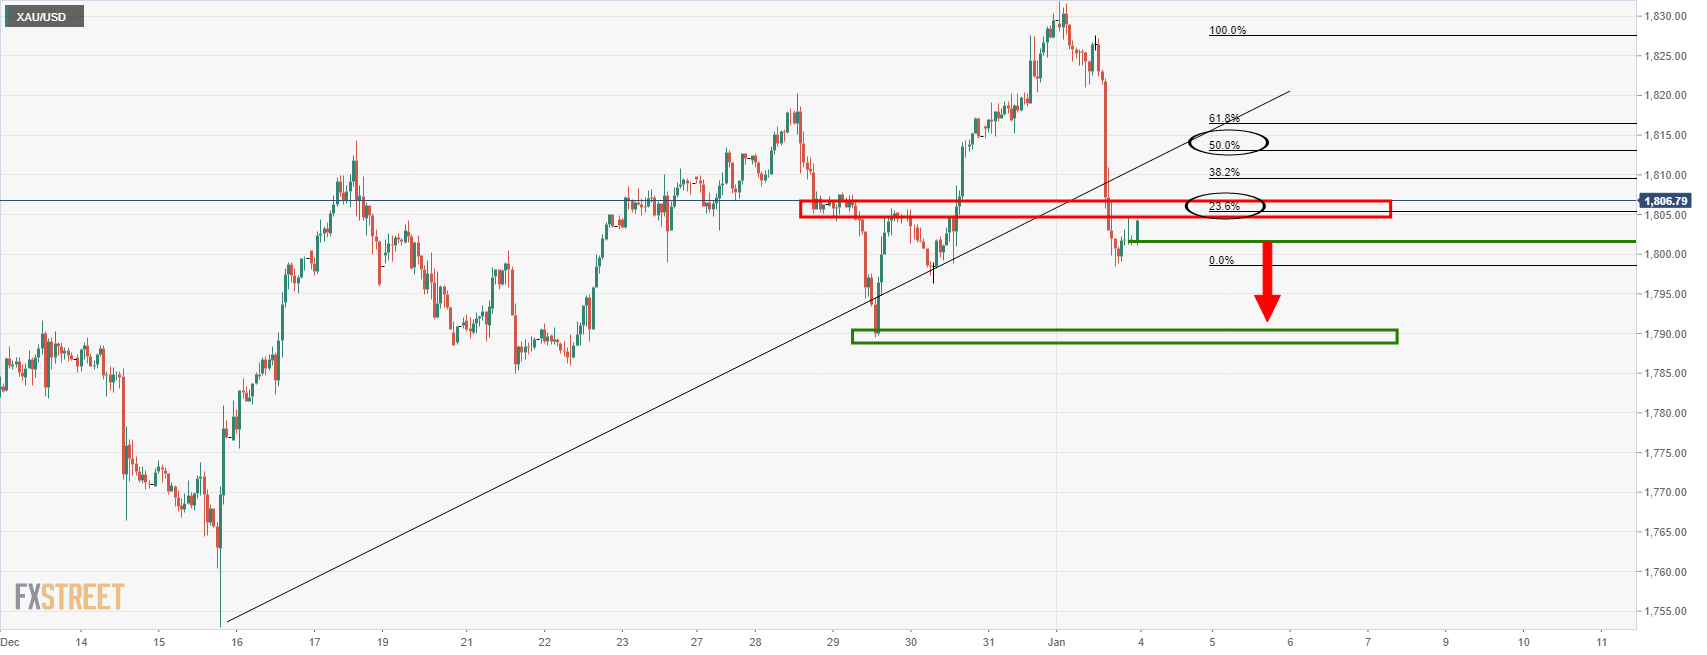
In the hourly chart above, we see that the price is embarking on old support that would be expected to act as a resistance near the 23.6% Fibonacci retracement level. A break there, however, opens risk to a 50% mean reversion of the same bearish hourly impulse. This meets the counter trendline resistance. If the price melts from here and below $1,800, then the immediate focus will be on the prior support near $1,790.
End of update
Gold (XAU/USD) stays defensive at around $1,800 after printing the biggest daily losses since November 22. That said, the yellow metal seesaws near the short-term support line amid a lack of fresh catalysts during the early Asian session on Tuesday.
Firmer US Treasury bond yields drowned commodities and propelled the US Dollar Index (DXY) the previous day. Even so, equities had a nice start in 2022.
That said, the DXY rose around 0.60% daily, around 96.00 at the latest, rising the most since mid-December on Monday. On the other hand, the US Treasury yields jumped to the six-week top for 30-year, 20-year, 10-year and 5-year notes.
The worsening coronavirus conditions raise challenges for the market sentiment and policymakers who previously expected the South African covid variant, namely Omicron, to be less severe than the previous virus variant. The risk-off mood also takes clues from the rising hopes of faster Fed rate-hikes in 2022. Both these catalysts weigh bond prices and fuel yields.
“COVID worries have been front and center once again for investors since the start of the holiday season. The number of new COVID-19 cases has doubled in the last seven days to an average of 418,000 a day, mostly attributed to the highly transmissible but milder Omicron variant,” according to a Reuters tally.
The US inflation expectations, as per the 10-Year Breakeven Inflation Rate numbers from the Federal Reserve Bank of St. Louis (FRED), jumped to a fresh high in six weeks to portray further prices pressure ahead, allowing Fed hawks to keep controls.
It’s worth noting that the softer prints of US Markit Manufacturing PMI for December, final reading failed to have a notable market impact as gold traders are more interested in today’s US ISM Manufacturing PMI for the said month, expected 60.2 versus 61.1.
Other than the US PMI, virus updates and Fed chatters will also direct short-term gold price moves. However, Wednesday’s Federal Open Market Committee (FOMC) Meeting Minutes and Friday’s US Nonfarm Payrolls (NFP) will be crucial to watch for clear direction.
Read: ISM Manufacturing PMI Preview: Low expectations in three figures open door to dollar upswing
Technical analysis
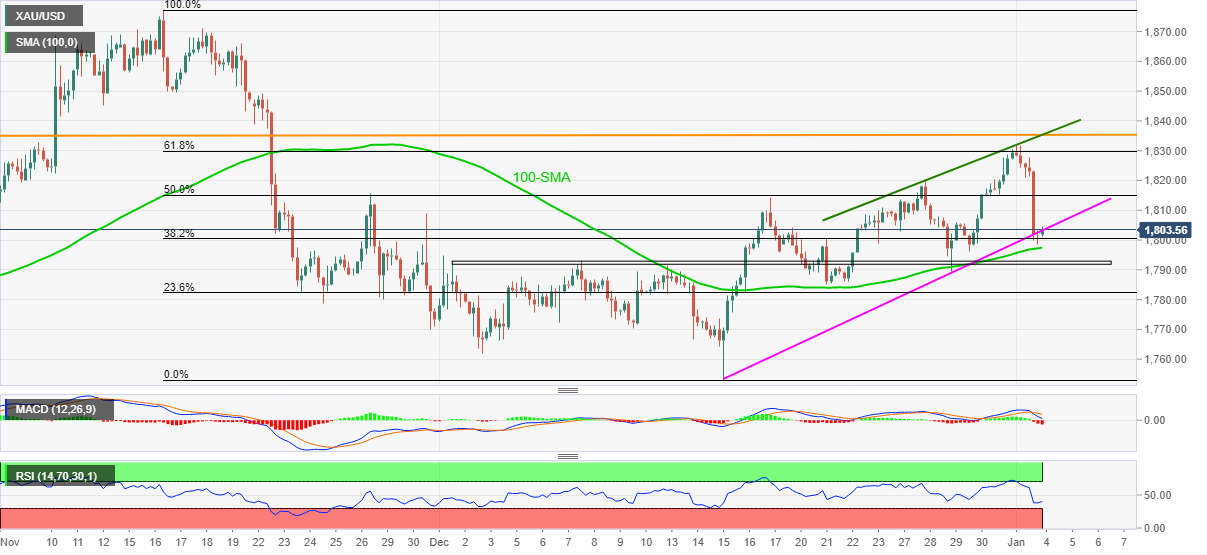
Gold’s pullback from 61.8% Fibonacci retracement of (Fibo.) of November 16 to mid-December downside takes clues from bearish MACD signals and descending RSI line, not oversold, to keep sellers hopeful.
Even so, an ascending support line from December 15, near the $1,800 threshold, quickly followed by the 100-SMA level surrounding $1,797, challenges the gold sellers.
Adding to the downside filter is the monthly horizontal area near $1,793-91, a break of which should give a free hand to the gold bears targeting the last monthly low near $1,753.
On the flip side, a convergence of weekly resistance line and tops marked in July, as well as in September, restricts short-term recovery moves of gold, in addition to the 61.8% Fibo. level surrounding $1,830.
Following that, a run-up towards $1,850 and $1,870 can’t be ruled out before directing gold buyers to November’s peak of $1,877.
Gold: Four-hour chart
Trend: Further weakness expected
Author

Anil Panchal
FXStreet
Anil Panchal has nearly 15 years of experience in tracking financial markets. With a keen interest in macroeconomics, Anil aptly tracks global news/updates and stays well-informed about the global financial moves and their implications.


