Gold Price Forecast: XAU/USD slips below $1,800 as USD lingers near highs
- Gold prices remain pressured for third consecutive day, off intraday low.
- Chatters over covid, US infrastructure bill test traders ahead of the key FOMC.
- US Durable Goods Orders, risk catalysts eyed for short-term direction.
- Gold Weekly Forecast: XAU/USD bears await break below 100-day SMA at $1,796

Update: Gold prices loiter near the $1,800 mark for the past five trading sessions. The US dollar remains steady near the four-month high ahead of the Fed’s interest rate decision. The prices moved cautiously despite the general negative sentiments surrounding the greenback. The yields on the benchmark US 10-year Treasury bonds recovered to 1.28% after retreating towards 1.27% on Monday. Investors remain reluctant to open new big positions as they await the FOMC meeting outcome for further clues on the central bank’s next move on stimulus and economic outlook. The meeting would be followed by the speech of the Fed Chair Jerome Powell, which could alter the trader’s sentiment. The demand is also affected by the rising coronavirus delta variant. The higher USD valuations make the precious metal expensive for the other currencies holders.
Gold (XAU/USD) licks its wounds around $1,798 amid a subdued Asian session on Tuesday. The yellow metal bounces off an intraday low, but remains depressed for the third day in a row, as market players embrace the week’s key data/events amid mixed risk-related headlines.
While the coronavirus numbers in the UK and Australia placate market bears, the US flashes mixed readings and challenge the optimists over economic recovery. Reuters recently said, “The US Centers for Disease Control and Prevention (CDC) and State Department on Monday both warned against travel to Spain, Portugal, Cyprus and Kyrgyzstan because of a rising number of COVID-19 cases in those countries.” The list also included the UK and India amid delta variant fears.
The jump in covid cases can be witnessed in the states with lower vaccinations, pushing local governments for jabbing and limiting the international travels despite strong lobbying by the airlines and travel companies.
Even so, Wall Street managed to refresh record top amid a jump in technology shares and as downbeat US housing and activity numbers back the Federal Reserve’s easy-money policy.
It should be noted that the global investors’ cautious mood ahead of Wednesday’s Federal Open Market Committee (FOMC) meeting joins the recent squabbling of the US Senators over President Joe Biden’s $1.2 trillion infrastructure plan to weigh on the sentiment. Additionally, the Sino-American tussles and China’s crackdown on technology companies may also challenge the gold traders.
Amid these plays, US 10-year Treasury yields remain firmer around 1.28% whereas S&P 500 Futures drop 0.10% despite the upbeat Wall Street close.
On a short-term basis, US Durable Goods Orders and Hosing Price Index for June will be important numbers to watch. Should the figures remain softer for June, the Fed will have another reason to reject tapering and back the gold buyers. It’s worth noting that the covid headlines and updates over US stimulus, not to forget the US-China news, should offer extra filters to gold moves.
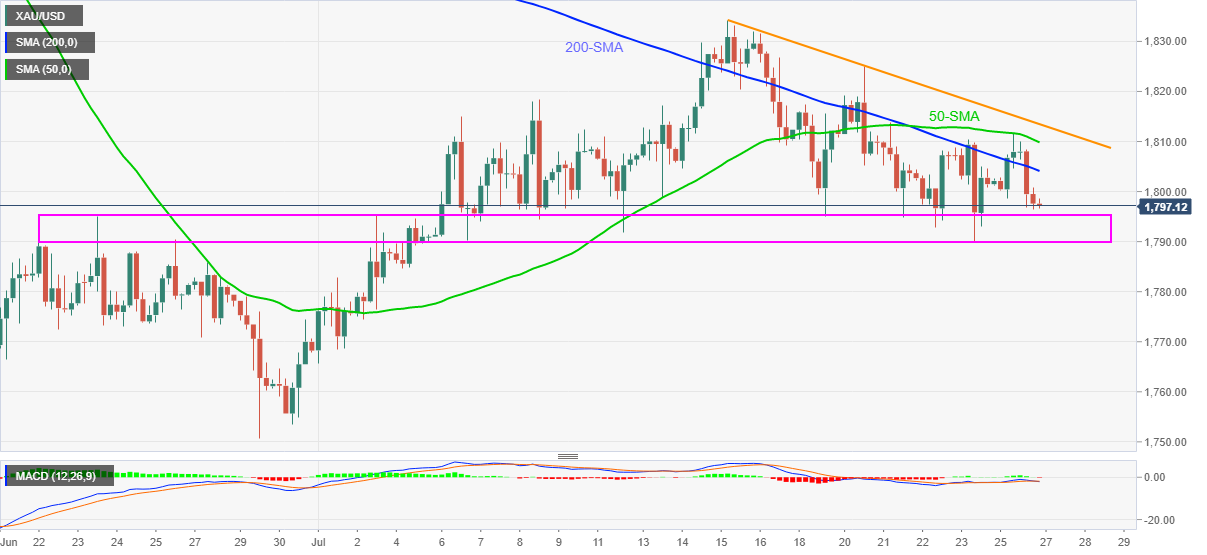
Technical analysis
Gold bears cheer sustained pullback from the key SMAs to attack five-week-old horizontal support.
As MACD flirts with sellers, a clear downside break of the broad region between $1,795 and $1,789 becomes necessary for the bears to dominate going forward.
Following that, the monthly low of around $1,768 will be in focus.
On the flip side, 200-SMA guards the quote’s immediate upside near $1,805 before the 50-SMA level of $1,810.
Also acting as the key resistance is a descending trend line from July 15 near $1,813.
Overall, gold bears inch closer to crucial levels and can keep the reins but it all depends upon the Fed at the last.
Gold: Four-hour chart
Trend: Further weakness expected
Author

Anil Panchal
FXStreet
Anil Panchal has nearly 15 years of experience in tracking financial markets. With a keen interest in macroeconomics, Anil aptly tracks global news/updates and stays well-informed about the global financial moves and their implications.


