Gold Price Forecast: XAU/USD resilient despite Fed’s rate hike speculations on solid US data
- Gold price regains momentum above $1900 despite increased odds of Fed rate hikes.
- US economic data underscores robust growth, pushing XAU/USD to test 200-day EMA.
- Treasury bond yields soar, underpinning projections of higher rates and potential headwinds for Gold demand.

Gold price recovers some ground after sliding below the $1900 figure for the first time since March 15, 2023, gains some 0.09%, after upbeat economic data from the United States (US) increased speculations the Federal Reserve (Fed) would proceed with additional rate hikes. In addition, the data pushed back against “hard landing” prospects, with the economy showing a strong pace of growth. The XAU/USD is trading at $1909.65 after hitting a daily low of $1893.17.
US economic data signals more Fed tightening; XAU/USD bulls hang on
The US economic calendar revealed outstanding figures for the US economy. The Gross Domestic Product (GDP) for the first quarter was upward revised from 1.3% to 2%, while jobs data reflected the robustness of the labor market. Initial Jobless Claims for the week ending June 24 came at 239K, well below estimates of 265K, snapping three weeks of readings above the 260K mark.
The data provides the good health of the US economy. After the numbers, Gold traders, amongst other market participants, began to price in additional tightening needed by the US Federal Reserve (Fed), which is set to increase rates in July by a quarter of a percentage point. The CME FedWatch Tool shows odds for a 0.25% hike at 87%, while US Treasury bond yields touched levels last seen since March 15.
The US 10-year Treasury note yield has risen to 3.854%, a gain of 14.4 basis points, while US real yields, a headwind for XAU/USD prices, is at 1.678%, its highest level since March 9.
Other data showed that Pending Home Sales plunged to a five-month low in May, coming at -22.2% YoY, worst than April’s -20% contraction.
Earlier, the US Federal Reserve Chair Jerome Powell said the labor market remains tight, inflation too high, and expressed the Fed’s “long way to go” before inflation gets back to its 2% goal. Powell noted the majority of the Federal Reserve Open Market Committee (FOMC) expects “two or more” interest rate increases by the end of the year.
Analysts cited by Bloomberg commented, “Today’s data showed that rates will be higher for longer.” The 2-year US Treasury bond yield, the most sensitive to monetary policy decisions, jumped as high as 4.893%. Money market futures for the November meeting showed odds at 34% for a rate increase to the 5.50%-5.75% range, as traders begin to believe the Fed will continue increasing borrowing costs, as noted in the latest dot-plot graph.
Against this backdrop, XAU/USD’s outlook is slightly tilted to the downside, though Gold bulls bought the dip at the 200-day Exponential Moving Average (EMA) at $1895.86. Nevertheless, additional positive data from the US depicting a solid economy could suggest higher rates, hence lower demand for the yellow metal.
XAU/USD Price Analysis: Technical outlook
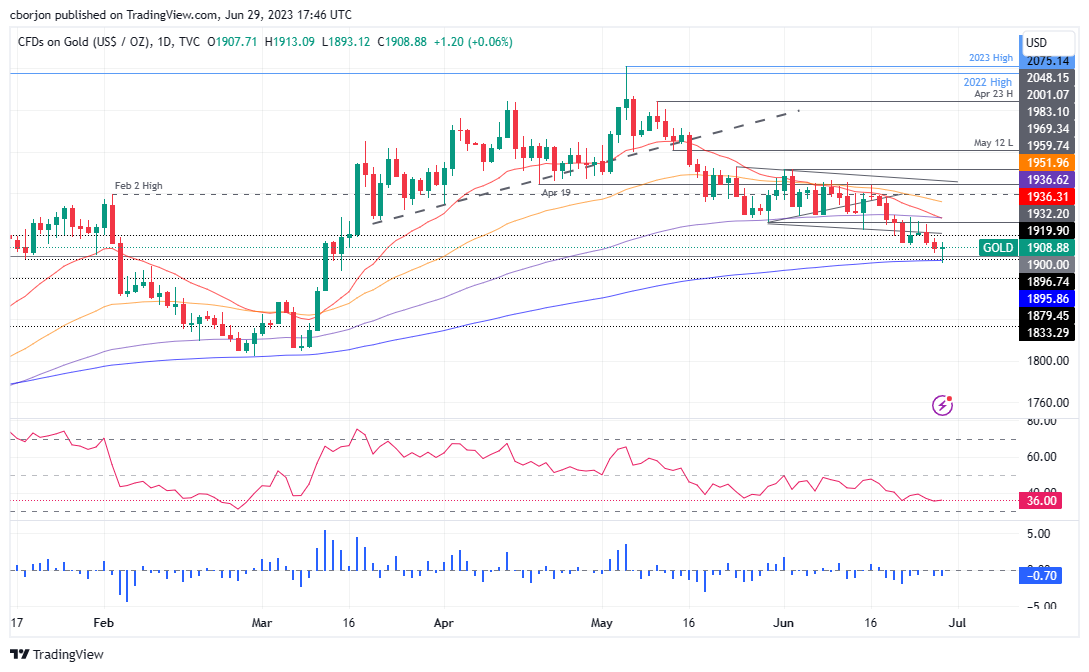
The XAU/USD remains neutral to downward biased, despite bouncing off the 200-day EMA. The Relative Strength Index (RSI) indicator is still pointing downwards, while the three-day Rate of Change (RoC), depicts sellers remain in charge. Unless XAU/USD buyers reclaim the May 30 daily low of $1932.20, which turned resistance, the non-yielding metal would be subject to further selling pressure. If XAU/USD buyers reclaim the latter, the next resistance would be the 20, 50-day EMAs intersection, at around $1936. On the other hand, an XAU/USD daily close below $1900 could pave the way for additional losses, below the 200-day EMA, with the $1850 psychological level as the first support, followed by the $1800 figure.
Author

Christian Borjon Valencia
FXStreet
Markets analyst, news editor, and trading instructor with over 14 years of experience across FX, commodities, US equity indices, and global macro markets.


