Gold Price Forecast: XAU/USD renews six-week low with eyes on $1,698, US NFP


  • Gold price stands on slippery grounds, prints five-day downtrend to refresh 1.5-month low.
  • Risk-aversion, firmer yields underpin US dollar rebound ahead of the key data.
  • Headlines surrounding China, US ISM Manufacturing PMI could also entertain XAU/USD traders.

Gold price (XAU/USD) portrays the market’s risk-aversion wave as it drops to the lowest levels since July 21 amid a rush toward the US dollar. That said, the yellow metal declined for the fifth consecutive day to $1,706 during Thursday’s Asian session.

The risk-aversion wave could be well-witnessed in the strong US Treasury yields despite the softer US data. As a result, the US 10-year Treasury yields refresh a two-month high of around 3.21% while the two-year bond coupons jump to the highest levels since 2007, near 3.51% at the latest. Also portraying the sour sentiment is the S&P 500 Futures’ 0.36% intraday fall to the lowest levels since late July, at 3,930 by the press time.

US data wasn’t either too positive but could manage to keep the greenback buyers hopeful amid the recently loose links between ADP and Nonfarm Payrolls (NFP). Also exerting downside pressure on the sentiment are Taiwan-China tension, fresh covid woes in Beijing and the United Nations (UN) Human Resource Office mentioning that the Chinese government has committed ‘serious human rights violations’ in Xinjiang. Additionally, a blockage in the Suez Canal by Singaporean-flagged oil tanker Affinity V previously challenged the risk appetite but the latest refloating of the ship couldn’t trigger the optimism.

That said, US ADP Employment Change rose by 132K versus 288K expected and 270K prior. However, the average wage increases in the US in August were 7.6% y/y and the same kept the Fed policymakers hawkish.

Following the data, Cleveland Federal Reserve Bank President Loretta Mester said on Tuesday that she was not anticipating the Fed to cut rates next year, as reported by Reuters. Further, the newly appointed Dallas Fed President Lory Logan joined the lines of hawkish fellow US central bankers while saying, “Restoring price stability is No. 1 priority.”

Not only in the US but strong Eurozone inflation data and the hawkish comments from the European Central Bank (ECB), as well as from the Bank of Japan (BOJ) policymakers, also portray the central bankers’ broadly hawkish stance.

Given the central bankers’ aggression, today’s US ISM Manufacturing PMI for August, expected 52.8 versus 52.0 prior, could entertain the traders ahead of Friday’s US Nonfarm Payrolls (NFP). Should the outcome manages to portray firmer US job conditions, as well as activities, the XAU/USD may witness further downside.

Also read: US ISM Manufacturing PMI Preview: Slowing growth or recession?

Technical analysis

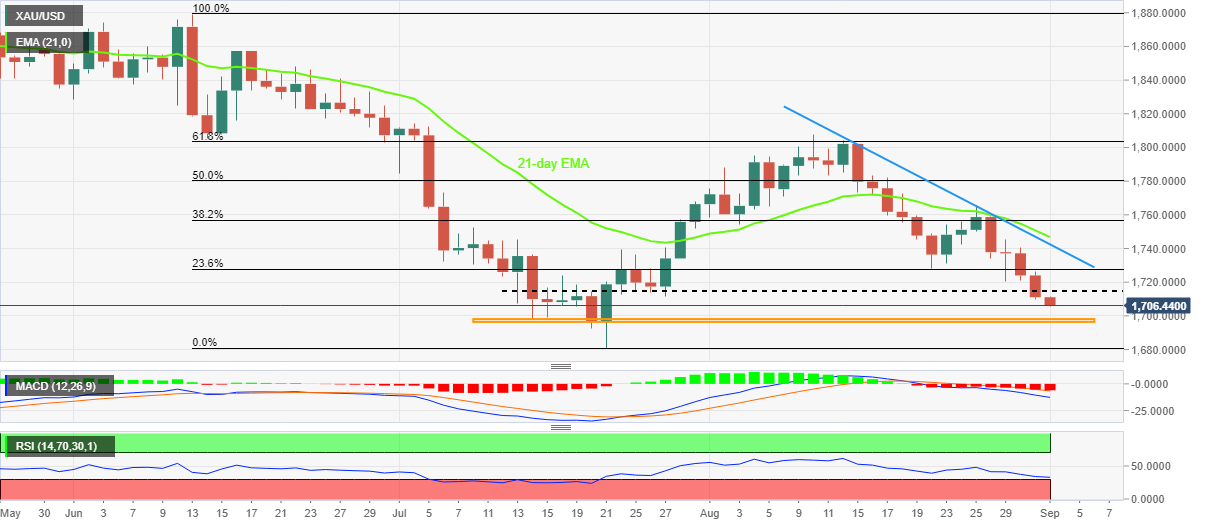
A clear downside break of the 1.5-month-old horizontal support, now resistance around $1,715, directs gold prices towards an area comprising lows marked during mid-July, near $1,698-96. Following that, the yearly bottom surrounding $1,680 will be in focus.

It’s worth observing that the RSI (14) is approaching the oversold territory and hence the XAU/USD may have limited downside room before posing a corrective pullback, which in turn highlights the $1,698-96 region for the bears.

Meanwhile, an upside clearance of $1,715 could direct gold price towards the 23.6% Fibonacci retracement level of June-July downside, near $1,728.

Following that, a 13-day-old resistance line and 21-day EMA, respectively near $1,741 and $1,747, as well as the $1,750 round figure, could challenge the gold price upside.

Gold: Daily chart

Trend: Limited downside expected

Additional important levels

Overview
Today last price 1706.26
Today Daily Change -4.80
Today Daily Change % -0.28%
Today daily open 1711.06
 
Trends
Daily SMA20 1763.12
Daily SMA50 1759.07
Daily SMA100 1813.2
Daily SMA200 1836.04
 
Levels
Previous Daily High 1726.62
Previous Daily Low 1709.68
Previous Weekly High 1765.51
Previous Weekly Low 1727.87
Previous Monthly High 1807.93
Previous Monthly Low 1709.68
Daily Fibonacci 38.2% 1716.15
Daily Fibonacci 61.8% 1720.15
Daily Pivot Point S1 1704.95
Daily Pivot Point S2 1698.85
Daily Pivot Point S3 1688.01
Daily Pivot Point R1 1721.89
Daily Pivot Point R2 1732.73
Daily Pivot Point R3 1738.83


Share: Feed news

Information on these pages contains forward-looking statements that involve risks and uncertainties. Markets and instruments profiled on this page are for informational purposes only and should not in any way come across as a recommendation to buy or sell in these assets. You should do your own thorough research before making any investment decisions. FXStreet does not in any way guarantee that this information is free from mistakes, errors, or material misstatements. It also does not guarantee that this information is of a timely nature. Investing in Open Markets involves a great deal of risk, including the loss of all or a portion of your investment, as well as emotional distress. All risks, losses and costs associated with investing, including total loss of principal, are your responsibility. The views and opinions expressed in this article are those of the authors and do not necessarily reflect the official policy or position of FXStreet nor its advertisers. The author will not be held responsible for information that is found at the end of links posted on this page.

If not otherwise explicitly mentioned in the body of the article, at the time of writing, the author has no position in any stock mentioned in this article and no business relationship with any company mentioned. The author has not received compensation for writing this article, other than from FXStreet.

FXStreet and the author do not provide personalized recommendations. The author makes no representations as to the accuracy, completeness, or suitability of this information. FXStreet and the author will not be liable for any errors, omissions or any losses, injuries or damages arising from this information and its display or use. Errors and omissions excepted.

The author and FXStreet are not registered investment advisors and nothing in this article is intended to be investment advice.

Recommended content


Recommended content

Editors’ Picks

AUD/USD dips below 0.6600 following RBA’s decision

AUD/USD dips below 0.6600 following RBA’s decision

The Australian Dollar registered losses of around 0.42% against the US Dollar on Tuesday, following the RBA's monetary policy decision to keep rates unchanged. However, it was perceived as a dovish decision. As Wednesday's Asian session began, the AUD/USD trades near 0.6591.

AUD/USD News

EUR/USD lacks momentum, churns near 1.0750

EUR/USD lacks momentum, churns near 1.0750

EUR/USD cycled familiar levels again on Tuesday, testing the waters near 1.0750 as broader markets look for signals to push in either direction. Risk appetite was crimped on Tuesday after Fedspeak from key US Federal Reserve officials threw caution on hopes for approaching rate cuts from the Fed.

EUR/USD News

Gold wanes as US Dollar soars, unfazed by lower US yields

Gold wanes as US Dollar soars, unfazed by lower US yields

Gold price slipped during the North American session, dropping around 0.4% amid a strong US Dollar and falling US Treasury bond yields. A scarce economic docket in the United States would keep investors focused on Federal Reserve officials during the week after last Friday’s US employment report.

Gold News

Solana FireDancer validator launches documentation website, SOL price holds 23% weekly gains

Solana FireDancer validator launches documentation website, SOL price holds 23% weekly gains

Solana network has been sensational since the fourth quarter (Q4) of 2023, making headlines with a series of successful meme coin launches that outperformed their peers.

Read more

Living vicariously through rate cut expectations

Living vicariously through rate cut expectations

U.S. stock indexes made gains on Tuesday as concerns about an overheating U.S. economy ease, particularly with incoming economic reports showing data surprises at their most negative levels since February of last year. 

Read more

Forex MAJORS

Cryptocurrencies

Signatures