Gold Price Forecast: XAU/USD awaits US data to break the monotony above $1,800
- Gold trades in a relatively tight range on Tuesday.
- XAU/USD continues to fluctuate between key moving averages.
- Focus shifts to ADP Employment Change and ISM Services PMI data from US.

Update: Gold (XAU/USD) remains sidelined around $1,810 amid early Asian morning on Wednesday, after posting mild losses the previous day.
The metal struggled for clear direction on Tuesday even as market sentiment was mildly positive and the US Dollar Index (DXY) failed to lure bulls despite upbeat Factory Orders for July.
The reason could be linked to the fresh geopolitical tussles concerning Iran and China, as well as the spike in the US covid cases versus easing infections at other developed nations. Additionally, hopes over US President Joe Biden-backed stimulus passage and the International Monetary Fund’s (IMF) record allocation to the Special Drawing Rights (SDRs) to battle the pandemic, not to forget upbeat earnings results, were extra positive that kept traders optimistic.
Amid these plays, Wall Street closed positive but the US 10-year Treasury yields remained unchanged.
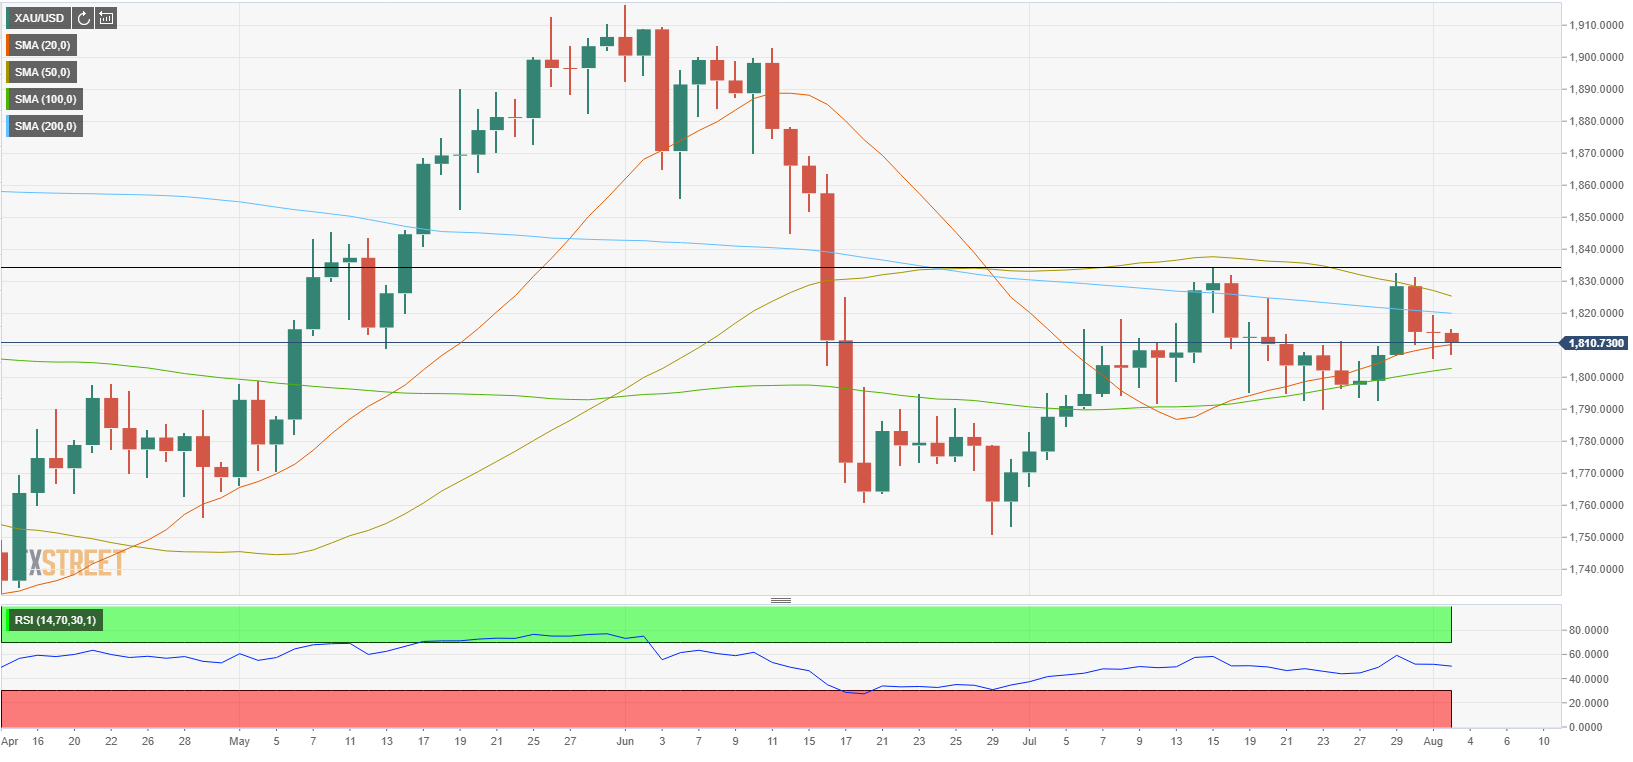
Gold traders may closely observe risk catalysts for immediate direction to break the sideways moves between the 100-day SMA and the 200-day SMA, respectively around $1,803 and $1,820. Also important are the monthly readings of the US ADP Employment Change and ISM Services PMIs.
Gold failed to make a decisive move in either direction on Monday and closed the day virtually unchanged at $1,814. On Tuesday, the XAU/USD pair continues to move up and down in a narrow range as investors wait for the next significant catalyst.
Earlier in the day, the data from the US showed that Factory Orders rose by 1.5%, or $7.4 billion, in June. Although this reading came in better than the market expectation for an increase of 1%, it was largely ignored by market participants. Additionally, the IBD/TIPP Economic Optimism Index edged lower to 53.6 in August from 54.3 in July. Following these data releases, the US Dollar Index stays flat on the day at 92.07.
Commenting on the USD's market valuation and its impact on gold prices, "we think the ongoing view that inflation spikes are mostly transitory and that the FOMC is not actively considering policy adjustments at the moment is mildly bullish gold at best and neutral at worst," said HSBC analysts. “In our view, no policy change, only a modest shift in the statement’s language and no new taper insights have understandably fostered little USD change, for now.”
Meanwhile, San Francisco Fed President Mary Daly said factors crimping the labour supply were temporary and added she expects most of the people who lost their jobs during the pandemic to return to the labour force as the economy recovers.
On Wednesday, the ADP Employment Change data and the ISM's Services PMI will be looked upon for fresh impetus. However, the market reaction to these data could remain muted ahead of Friday's highly-anticipated Nonfarm Payrolls report.
US ADP Employment Change July Preview: Jobs gains in service sector to slowdown.
ISM Services PMI Preview: Business psychology begins to deteriorate.
Gold technical outlook
Gold technical outlook remains neutral as the Relative Strength Index (RSI) continues to stay flat around 50. Additionally, the price is still stuck between key moving averages.
On the upside, the first hurdle aligns at $1,820 (200-day SMA). In case gold makes a daily close above that level, it could aim for $1,825 (50-day SMA) and $1,835 (July 15 high).
Supports, on the other hand, are located at $1,810 (20-day SMA), $1,800 (100-day SMA, psychological level, Fibonacci 50% retracement of the April-June uptrend) and $1,790 (July 23 low). Nevertheless, a drop below $1,810 could be ignored by sellers and the bearish momentum is likely to gather strength once the price declines below $1,800.
Additional levels to watch for
Author

Eren Sengezer
FXStreet
As an economist at heart, Eren Sengezer specializes in the assessment of the short-term and long-term impacts of macroeconomic data, central bank policies and political developments on financial assets.


