Gold Price Forecast: XAU/USD pulls back from two-week high as Fed’s decision looms


Share:
  • Gold price hit a two-week high at $1937.35 before retreating to $1931.77, down 0.06%.
  • US 10-year Treasury bond yield reaches a 16-year high at 4.367%, weighing on gold.
  • Investors keenly await the Federal Reserve’s ‘dot plots’ and updated economic projections for rate hike clues.

Gold price retreats after hitting a two-week high at $1937.35 as investors remain on the sidelines ahead of the US Federal Reserve monetary policy decision. US Treasury bond yields are climbing ahead of the Fed’s decision, a headwind for the yellow metal, which was shy of clashing with the 100-DMA. At the time of writing, the XAU/USD is trading at $1931.77, down 0.06%.

Gold retreats as investors await the Federal Reserve’s monetary policy announcement, with rising US Treasury yields adding pressure

Wall Street continues to print losses, while the US 10-year Treasury bond yield touches a 16-year high at 4.367%. Tomorrow, Fed Chair Jerome Powell and his colleagues are expected to keep rates at the current 5.25%-5.50% range and to keep them higher for longer, at least until July 2024, as drawn by the Fed money market futures.

Even though the latest round of data showed that inflation has registered back-to-back upticks, the US central bank is set to skip a rate hike in September. According to the CME FedWatch Tool, odds for the November and December meeting had been lowered, suggesting that traders are not expecting additional rate hikes toward the end of 2023.

Although the Fed’s decision is important, market participants would be focused on the ‘dot plots’ to review the US central bank interest rate path. According to the latest Summary of Economic Projections (SEP), the Fed’s median estimates rates to peak at 5.6%. A confirmation could catch off guard interest rate traders, which expect rates to be capped at 5.50%.

In the meantime, the US Dollar Index (DXY) remains firm at around 105.14, gains 0.06%, underpinned by high US Treasury bond yields. The US 10-year Treasury note yields 4.367%, its highest level in 16 years, a headwind for Gold prices.

Meanwhile, Gold traders must also be aware of US Real yields, which could be followed using TIPS (Treasury Inflation Protected Securities) as a proxy. When the US 10-year TIPS coupon rises, XAU/USD’s price falls, as shown by the following chart, depicting the inverse correlation between the assets.
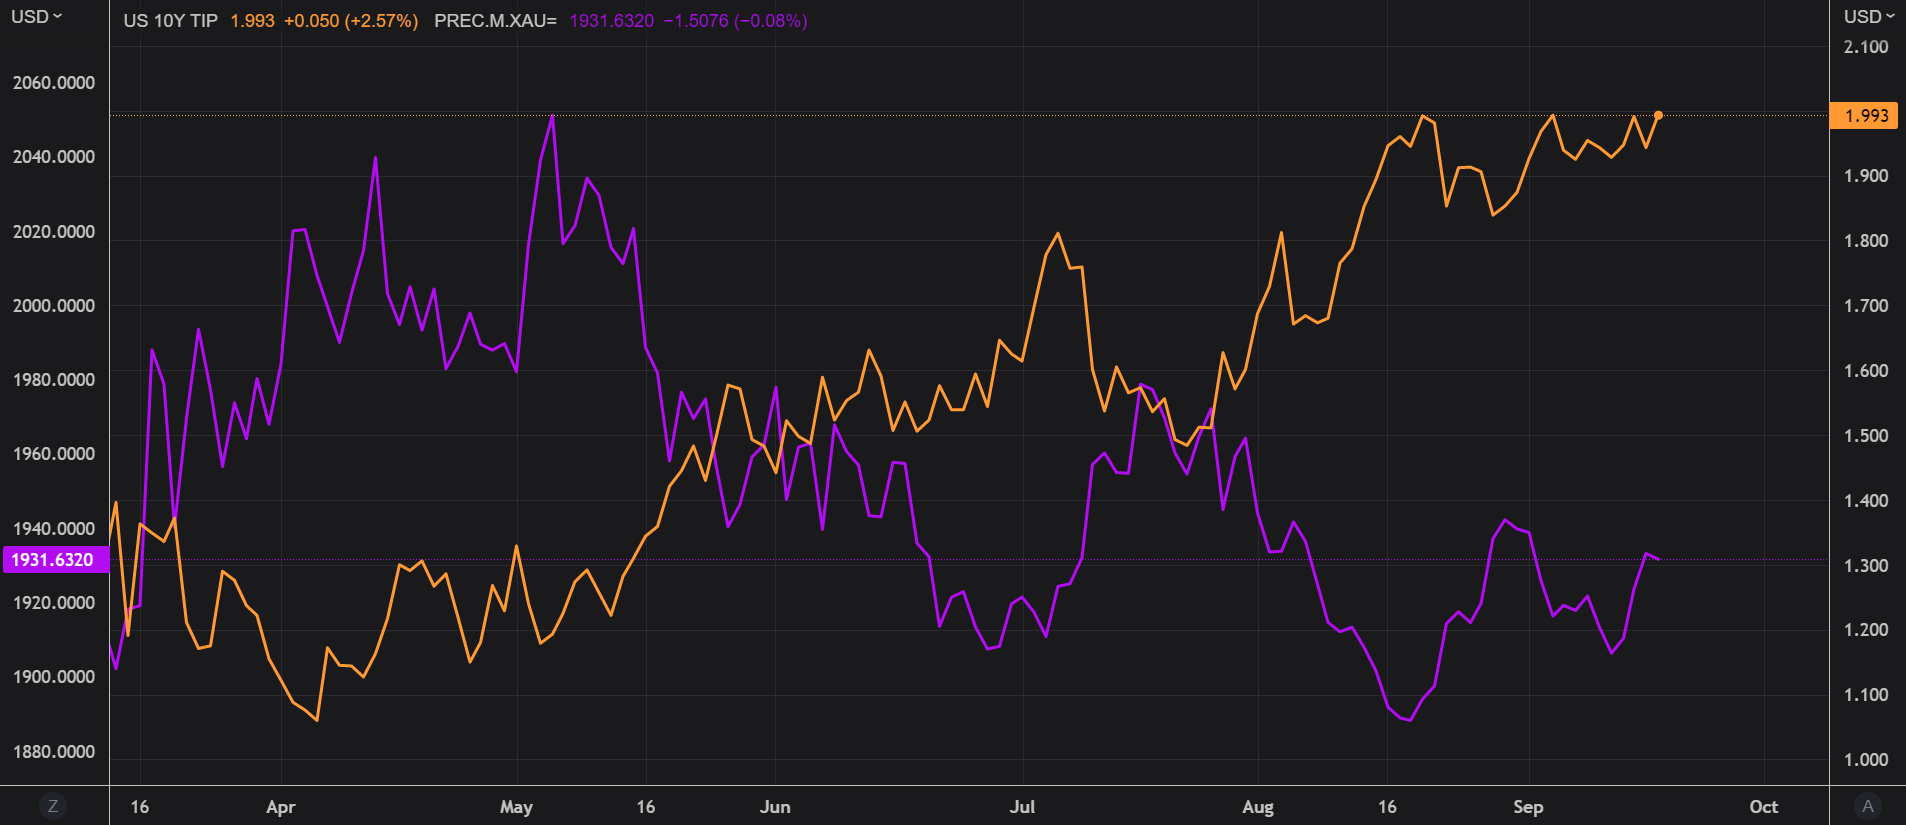
Source: Refinitiv

The US economic docket would feature the Fed’s decision on Wednesday, followed by US housing data, unemployment claims, and S&P Global PMIs.

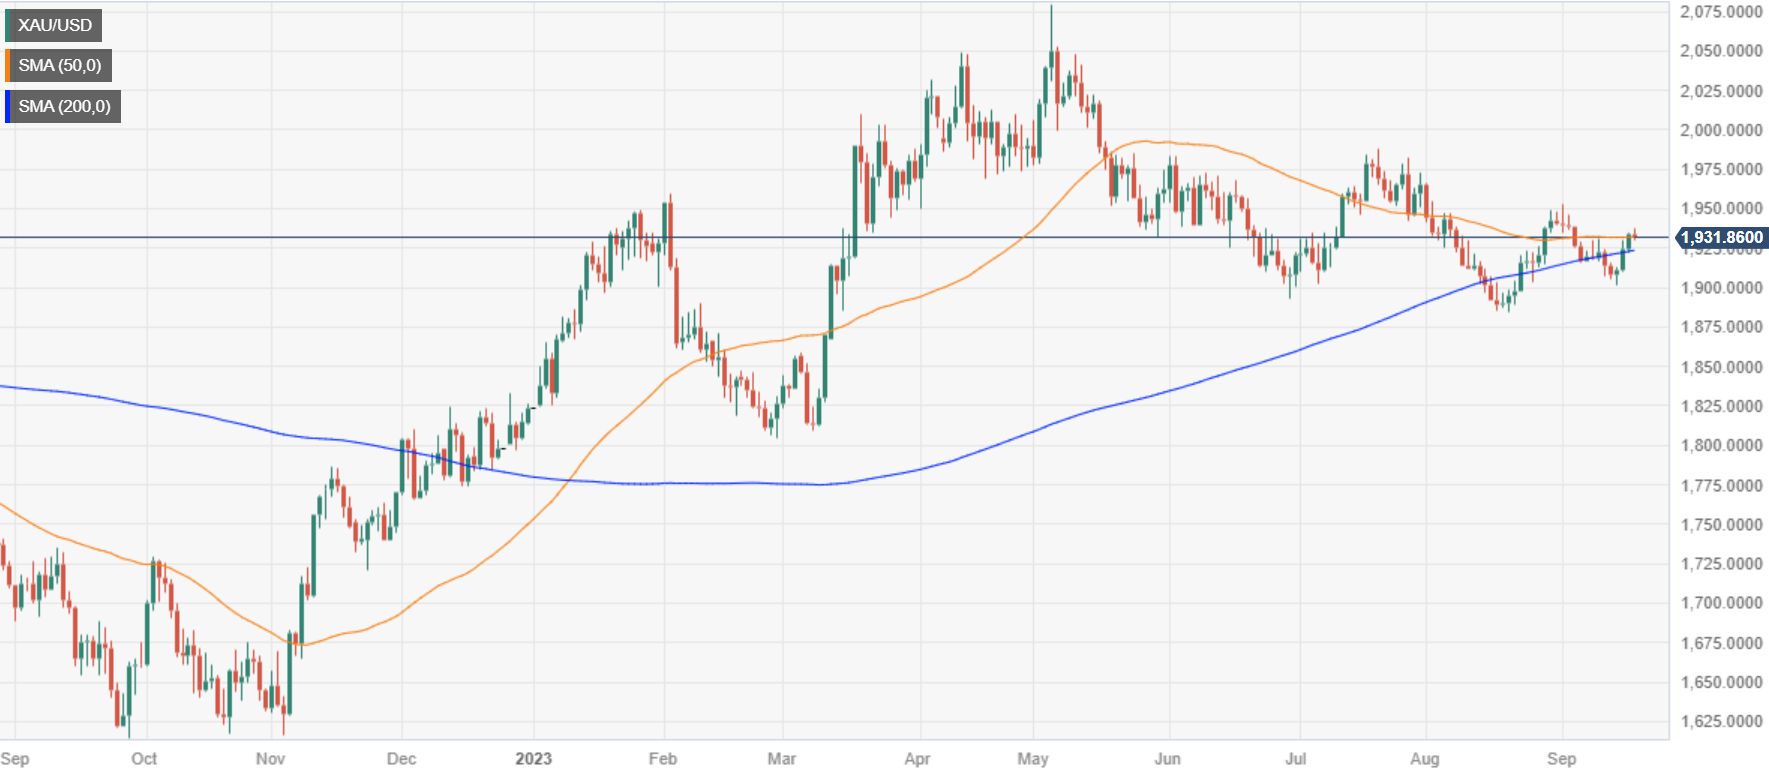
XAU/USD Price Analysis: Technical outlook

Gold trades sideways inside a descending triangle, cushioned on the downside by a confluence of daily moving averages (DMAs), and the 100-DMA acts as resistance at $1945.20. Although it recorded a higher low on September 14 at $1901.11, it has failed to print a higher peak above the July 20 swing high at $1987.42. If buyers want to shift the bias to neutral, they must reclaim the latter. Otherwise, a break below the confluence of the 20 and 200-DMA around $1924.00 could pave the way to challenge $1900, followed by the August 21 daily low of $1884.89

XAU/USD

Overview
Today last price 1931.99
Today Daily Change -1.83
Today Daily Change % -0.09
Today daily open 1933.82
 
Trends
Daily SMA20 1922.88
Daily SMA50 1932
Daily SMA100 1946.42
Daily SMA200 1922.91
 
Levels
Previous Daily High 1934.32
Previous Daily Low 1922.62
Previous Weekly High 1930.77
Previous Weekly Low 1901.07
Previous Monthly High 1966.08
Previous Monthly Low 1884.85
Daily Fibonacci 38.2% 1929.85
Daily Fibonacci 61.8% 1927.09
Daily Pivot Point S1 1926.19
Daily Pivot Point S2 1918.55
Daily Pivot Point S3 1914.49
Daily Pivot Point R1 1937.89
Daily Pivot Point R2 1941.95
Daily Pivot Point R3 1949.59


Share: Feed news

Information on these pages contains forward-looking statements that involve risks and uncertainties. Markets and instruments profiled on this page are for informational purposes only and should not in any way come across as a recommendation to buy or sell in these assets. You should do your own thorough research before making any investment decisions. FXStreet does not in any way guarantee that this information is free from mistakes, errors, or material misstatements. It also does not guarantee that this information is of a timely nature. Investing in Open Markets involves a great deal of risk, including the loss of all or a portion of your investment, as well as emotional distress. All risks, losses and costs associated with investing, including total loss of principal, are your responsibility. The views and opinions expressed in this article are those of the authors and do not necessarily reflect the official policy or position of FXStreet nor its advertisers. The author will not be held responsible for information that is found at the end of links posted on this page.

If not otherwise explicitly mentioned in the body of the article, at the time of writing, the author has no position in any stock mentioned in this article and no business relationship with any company mentioned. The author has not received compensation for writing this article, other than from FXStreet.

FXStreet and the author do not provide personalized recommendations. The author makes no representations as to the accuracy, completeness, or suitability of this information. FXStreet and the author will not be liable for any errors, omissions or any losses, injuries or damages arising from this information and its display or use. Errors and omissions excepted.

The author and FXStreet are not registered investment advisors and nothing in this article is intended to be investment advice.

Follow us on Telegram

Stay updated of all the news

Join Telegram

Recommended content


Follow us on Telegram

Stay updated of all the news

Join Telegram

Recommended content

Editors’ Picks

EUR/USD loses traction, retreats below 1.0600

EUR/USD loses traction, retreats below 1.0600

EUR/USD lost its recovery momentum and declined below 1.0600 in the American session on Friday, erasing a portion of its daily gains in the process. Nevertheless, the risk-positive market atmosphere after PCE inflation data helps the pair limit its losses.

EUR/USD News

GBP/USD turns negative on the day below 1.2200

GBP/USD turns negative on the day below 1.2200

GBP/USD reversed its direction and slumped below 1.2200 in the American session on Friday after rising above 1.2270 earlier in the day. Position readjustments and profit-taking on the last trading day of the quarter seems to be weighing on Pound Sterling.

GBP/USD News

Gold reverses direction, drops below $1,860

Gold reverses direction, drops below $1,860

Following a steady rebound toward $1,880 on Friday, Gold price made a sharp U-turn and turned negative on the day near $1,860. Although the 10-year US T-bond yield is down more than 1%, XAU/USD struggles to find demand on the last day of Q3.

Gold News

Polkadot Price Forecast: DOT reversal seems inevitable after 92% correction from all-time high

Polkadot Price Forecast: DOT reversal seems inevitable after 92% correction from all-time high

Polkadot price, in nearly two years, has shed 92.91% from its all-time high of $55.09. The massive downswing in DOT has pushed it down to levels that were last seen in October 2020. Hence, the chances of this altcoin forming a bottom and rallying are high. 

Read more

Earnings beat triggers Nike to spike 9%

Earnings beat triggers Nike to spike 9%

Nike (NKE) stock has surged over 9% in Friday’s premarket, climbing above $98 per share, following late Thursday’s fiscal first-quarter earnings release. Nike beat pessimistic earnings expectations by more than 23% and hiked its dividend by 9%.

Read more

Forex MAJORS

Cryptocurrencies

Signatures