Gold Price Forecast: XAU/USD looks to $1,950 again ahead of Russia-Ukraine peace talks – Confluence Detector
- Gold price attempts a fresh run towards $1,950 after Wednesday’s downfall.
- Stagflation fears outweigh firmer Treasury yields to lift gold price northwards.
- Will gold retest $1,950 on Russia-Ukraine peace talks 2.0, Powell?

Gold price extends its range play around the $1,930 level for the third consecutive day, reversing a part of Wednesday’s sell-off. Soaring oil prices, a fallout of the Russia-Ukraine crisis, have refueled stagflation concerns worldwide, reviving gold’s demand as a safe haven. Meanwhile, the US dollar continues to hold fort amid ongoing strength in the Treasury yields due to the hawkish Fed Chair Jerome Powell’s testimony. The next direction in gold price hinges on the outcome of round two of the Russia-Ukraine ‘peace talks’ while the US economic data will continue to play second fiddle.
Read: Gold trades at major yearly resistance
Gold Price: Key levels to watch
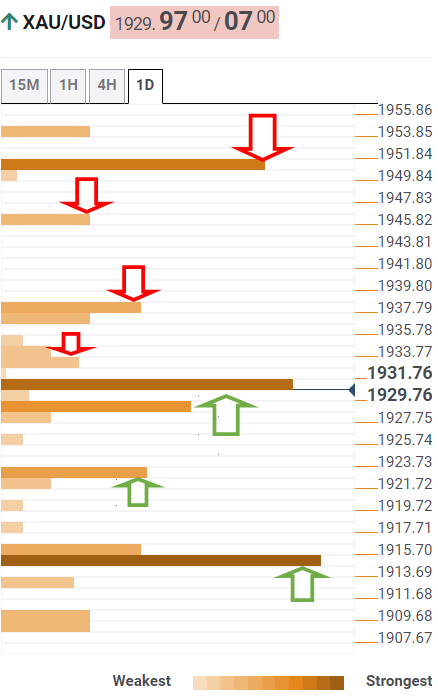
The Technical Confluences Detector shows that gold price is battling minor resistance around $1,933, where the SMA10 four-hour aligns.
Recapturing the latter will cheer buyers, propelling the price towards $1,937, which is the confluence of the Fibonacci 61.8% one-week and one-day.
Gold traders will create fresh buying opportunities above that level, triggering a fresh rally towards the pivot point one-day R1 at $1,945.
The $1,950 barrier remains the level to beat for gold bulls. At that point, the previous day’s high and pivot point one-week R1 coincide.
Alternatively, a decisive break below the $1,930-$1,929 support area is needed to resume the previous downside momentum.
That zone is the convergence of the Fibonacci 23.6% one-month, Fibonacci 38.2% one-day and SMA5 four-hour.
The next relevant support awaits at $1,922, the intersection of the intraday low, Fibonacci 23.6% one-day and Bollinger Band four-hour Middle.
Gold bears will need to crack the $1,915 cap to take on the additional downside. The Fibonacci 38.2% one-week, the previous day’s low and SMA5 one-day meet at that point.
Here is how it looks on the tool
About Technical Confluences Detector
The TCD (Technical Confluences Detector) is a tool to locate and point out those price levels where there is a congestion of indicators, moving averages, Fibonacci levels, Pivot Points, etc. If you are a short-term trader, you will find entry points for counter-trend strategies and hunt a few points at a time. If you are a medium-to-long-term trader, this tool will allow you to know in advance the price levels where a medium-to-long-term trend may stop and rest, where to unwind positions, or where to increase your position size.
Author

Dhwani Mehta
FXStreet
Residing in Mumbai (India), Dhwani is a Senior Analyst and Manager of the Asian session at FXStreet. She has over 10 years of experience in analyzing and covering the global financial markets, with specialization in Forex and commodities markets.


