Gold Price Forecast: XAU/USD keeps bearish potential intact towards $1,750 – Confluence Detector
- Gold price sees a dead cat bounce as the tide turns against bulls.
- Fed minutes, US-Taiwan geopolitical news and Chinese stimulus hopes lend support.
- XAU/USD bears need to crack the critical $1,755 level to extend the downside.

Gold price is seeing a relief rally on Thursday, as bears take a breather after the three-day sell-off. The renewed uptick in the bright metal draws support from Wednesday’s Fed minutes, which signaled that a dovish shift could be soon on the cards. The Fed minutes revealed that “as the stance of monetary policy tightened further, it likely would become appropriate at some point to slow the pace of policy rate increases while assessing the effects of cumulative policy adjustments on economic activity and inflation.” Further, concerns that a potential US-Taiwan trade agreement could re-kindle geopolitical tensions with China, revived the safe-haven demand for the precious metal. The bullion also finds comfort from increased expectations of more Chinese stimulus, as they seek to boost growth. Although the recent strength in the US dollar could regain traction amid risk aversion, which may hinder the recovery in XAU/USD price.
Also read: Gold Price Forecast: Bears pressuring a critical Fibonacci support
Gold Price: Key levels to watch
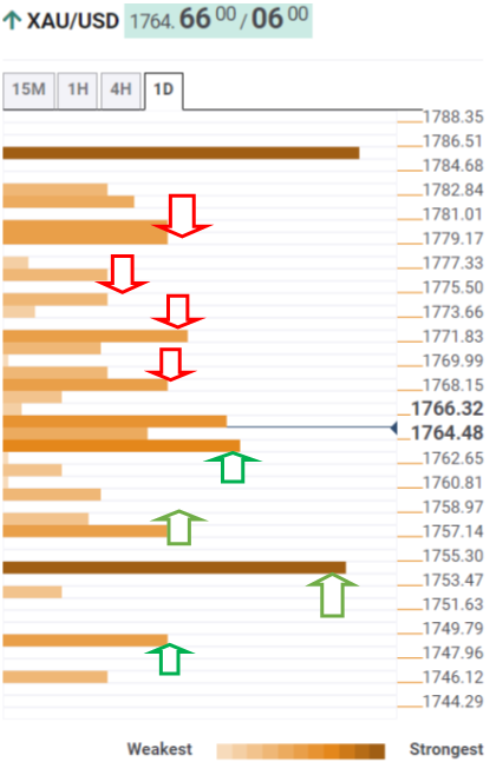
The Technical Confluence Detector shows that the gold price is battling strong support around $1,764, which is the convergence of the Fibonacci 23.6% one-day, Bollinger Band one-day Middle and Fibonacci 61.8% one-month.
The next support awaits at the previous day’s low of $1,762, below which sellers will aim for the pivot point one-week S2.
A breach of the pivot point one-day S1 at $1,755 will expose the critical $1,750 psychological cap.
Alternatively, the Fibonacci 38.2% one-day at $1,768 will offer immediate resistance, followed by the previous week’s low of $1,771.
The next significant upside barriers for the yellow metal are aligned at the Fibonacci 61.8% one-day at $1,775 and the SMA 50 one-day at $1,777.
Here is how it looks on the tool
About Technical Confluences Detector
The TCD (Technical Confluences Detector) is a tool to locate and point out those price levels where there is a congestion of indicators, moving averages, Fibonacci levels, Pivot Points, etc. If you are a short-term trader, you will find entry points for counter-trend strategies and hunt a few points at a time. If you are a medium-to-long-term trader, this tool will allow you to know in advance the price levels where a medium-to-long-term trend may stop and rest, where to unwind positions, or where to increase your position size.
Author

Dhwani Mehta
FXStreet
Residing in Mumbai (India), Dhwani is a Senior Analyst and Manager of the Asian session at FXStreet. She has over 10 years of experience in analyzing and covering the global financial markets, with specialization in Forex and commodities markets.

















