Gold Price Forecast: Bears pressuring a critical Fibonacci support

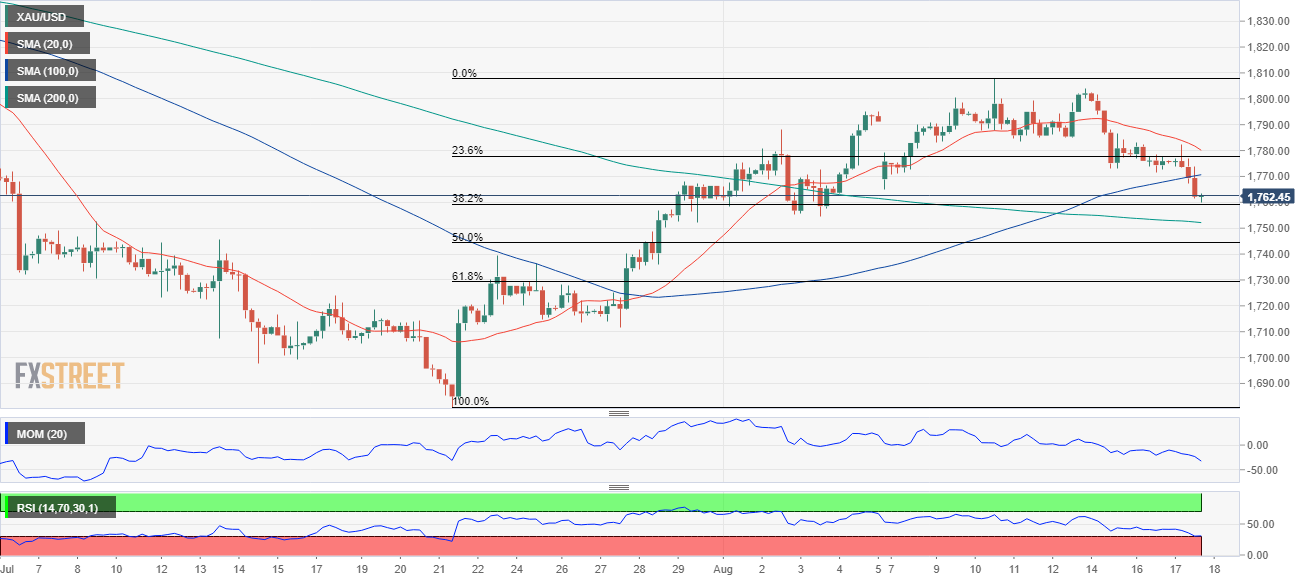
XAUUSD Current price: $1,762.45
- Government bond yields jumped ahead of the FOMC Meeting Minutes.
- European and American indexes trade turned south amid tepid US data.
- XAUUSD is pressuring the 38.2% retracement of its latest daily advance.
The American dollar is the overall winner across the FX board on Wednesday and ahead of the release of the FOMC Meeting Minutes, with XAUUSD trading near a fresh one-week low of $1,7659.82 a troy ounce. The slide accelerated ahead of the US opening amid rising government bond yields. The yield on the 10-year Treasury note peaked at 2.919% and holds nearby ahead of news from the Federal Reserve.
Meanwhile, stock buyers gave up. After struggling throughout the first half of the week, global indexes turned red. European indexes closed with losses, while US ones hover near intraday lows. Softer-than-anticipated US macroeconomic figures undermined demand for the high-yielding assets, as Retail Sales in the country remained flat in July, missing the market expectations.
As for the FOMC Meeting Minutes, it is worth remembering the document is meant to explain policymakers’ thoughts when they decided to hike rates in July. In between the outcome of their July meeting and the statement's release, the country published an encouraging Consumer Price Index, as it rose by 8.6% YoY in July, easing from the previous 9.1%.
Gold price short-term technical outlook
The XAUUSD pair is at the brink of turning bearish in the mid-term. The daily chart shows that the pair is battling the 38.2% retracement of its latest daily run measured between $1,680.82 and $1,807.86 at $1,759.10. Technical indicators head firmly lower, the Momentum around its 100 level but the RSI is already at 46. At the same time, the pair is currently crossing below a bullish 20 SMA for the first time in over a month.
In the near term, and according to the 4-hour chart, the risk is skewed to the downside. The bright metal is developing below its 20 and 100 SMAs, while technical indicators hold within negative levels, with neutral-to-bearish slopes. A break below the aforementioned Fibonacci support should open the door to a steeper decline towards the $1,730 price zone.
Support levels: 1,759.10 1,745.20 1,735.90
Resistance levels: 1,769.90 1,783.10 1,792.30
Author

Valeria Bednarik
FXStreet
Valeria Bednarik was born and lives in Buenos Aires, Argentina. Her passion for math and numbers pushed her into studying economics in her younger years.


