Gold Price Forecast: XAU/USD keeps $1,960 in the spotlight as United States inflation loom
- Gold Price bounces off multi-month-old support line as US Dollar ended three-week uptrend on a softer note.
- Downbeat sentiment provides tailwind to US Dollar even as mixed United States data, US credit rating downgrade prod Fed hawks.
- US inflation will be crucial amid easing concerns about Federal Reserve’s September rate hike, downbeat CPI can propel XAU/USD rebound.

Gold Price (XAU/USD) begins the week comprising the key United States inflation without much surprises as it defends the previous day’s corrective bounce off an important support line, mainly backed by mixed US employment report, during early Monday in Asia. In doing so, the XAU/USD seesaws near $1,943, flirting with the 50-DMA hurdle by the press time.
That said, the Gold Price dropped in the last two consecutive weeks, marking the biggest weekly loss since mid-June, as the US Dollar Index (DXY) managed to print a three-week uptrend despite witnessing mixed data and easing concerns about the Federal Reserve’s (Fed) rate hike in September. The reason could be linked to the risk aversion wave, mainly backed by the Fitch Ratings’ US credit rating downgrade. With this, the Gold traders are more excited about this week’s US inflation numbers, namely the Consumer Price Index (CPI) and Producer Price Index (PPI) for July for clear directions.
Gold Price recovery appears elusive as US Dollar ignores indecision about Federal Reserve
US Dollar managed to post a three-week winning streak as the market’s risk-off tone superseded unimpressive United States data, which in turn exerted downside pressure on the Gold Price despite Friday’s corrective bounce.
Talking about the data, the headline employment report posted a softer-than-expected Nonfarm Payrolls (NFP) figure of 187K, versus 185K prior (revised) and 200K market forecasts, whereas the Unemployment Rate eased to 3.5% from 3.6% expected and previous readings. Further, the Average Hourly Earnings reprinted 0.4% MoM and 4.4% YoY numbers by defying the expectations of witnessing a slight reduction in wage growth.
Also notable is the fact that the ISM Manufacturing PMI for July improved a bit but the more important Services PMI dropped for the said month. Additionally, US Factory Orders edged higher for June and so did the second-tier employment-linked data like Nonfarm Productivity and JOLT Job Openings. However, the Q2 Unit Labor Cost eased and troubled favoring the Fed’s September rate hike.
Earlier in July, the Federal Reserve’s (Fed) preferred inflation gauge eased previously but the US Gross Domestic Product (GDP) Annualized for the second quarter (Q2) managed to impress with upbeat growth figures.
Considering these data, the market’s bets on the Fed’s September rate hike eased from 20.0% to 13% on a weekly basis, per the CME’s FedWatch Tool.
With this in mind, Atlanta Federal Reserve Bank President Raphael Bostic said on Friday to Bloomberg, that the central bank is likely to keep monetary policy in a restrictive territory well into 2024. On the contrary, Chicago Fed President Austan Goolsbee stated that they should start thinking about how long to hold rates.
Hence, most of the United States statistics have been mixed and may not be the key reason for the US Dollar Index (DXY) run-up, which in turn highlights the Fitch Ratings’ downward revision to the US credit rating from AAA to AA+. The same joins the US-China tension and mixed earnings from the US corporate giants to spoil the sentiment and the Gold Price.
XAU/USD bulls need validation from United States inflation data
While mixed feelings provided headwinds to the Gold Price, important support and decline in Friday’s US Nonfarm Payrolls (NFP), as well as consolidation of the weekly losses in equities, allowed the metal to recover. Also, a pullback in the US 10-year Treasury bond yields from the yearly high helped the XAU/USD to rebound without impressively downbeat US data. Hence, Gold traders will pay attention to this week’s United States inflation clues for July, via the CPI, PPI and the University of Michigan’s inflation expectations. Should the scheduled data suggest easing price pressure in the world’s largest economy, the Gold Price may rise further toward the key $1,960 hurdle.
Also read: Gold Price Weekly Forecast: Bulls and bears in tug-of-war ahead of US inflation data
Gold Price Technical Analysis
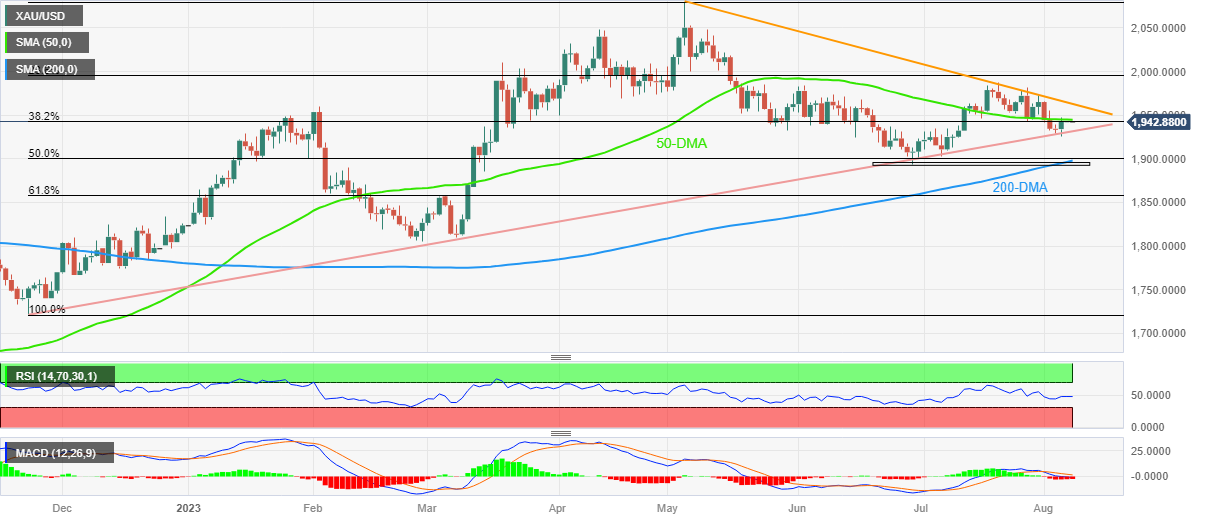
Gold Price recovers from an upward-sloping support line from late November 2022, backed by an upswing in the Relative Strength Index (RSI) line, placed at 14.
Even so, the bearish signals from the Moving Average Convergence and Divergence (MACD) indicator joined the 50-DMA hurdle of near $1,945 to check the XAU/USD bulls.
With this, the Gold Price appears well-set to extend the latest rebound past the $1,945 immediate DMA hurdle. However, a three-month-long downward-sloping resistance line challenges the buyers around $1,960.
That said, a daily closing beyond the $1,960 hurdle will enable the Gold Price to rise toward the previous monthly high of around $1,987 ahead of highlighting the $2,000 psychological magnet on the bull’s radar.
Meanwhile, failure to provide successful trading beyond the 50-DMA hurdle of around $1,945 can drag the XAU/USD back to the aforementioned support line of around $1,933 at the latest.
Following that, the $1,900 threshold may check the Gold sellers before directing them to the key $1,895-93 support confluence comprising the 200-DMA and June’s low.
Overall, the Gold Price is likely to witness further recovery but the upside appears limited.
Gold Price: Daily chart
Trend: Limited recovery expected
Author

Anil Panchal
FXStreet
Anil Panchal has nearly 15 years of experience in tracking financial markets. With a keen interest in macroeconomics, Anil aptly tracks global news/updates and stays well-informed about the global financial moves and their implications.