Gold Price Forecast: XAU/USD drops further below $1,950 amid firmer US dollar, yields
- Gold prices consolidate recent gains amid sour sentiment, firmer USD.
- Yields underpin USD as BOJ acts, Fedspeak suggests faster rate hikes.
- Anxiety over Ukraine-Russia talks, China’s covid woes add strength to the risk-off mood.
- Gold Price Forecast: $1,935 holds the key for XAU/USD as King dollar reigns supreme.

Update: Gold price is extending its weakness below $1,950, having failed to find acceptance above the $1,960 barrier in the previous week. Markets remain risk-averse amid rising concerns over the covid resurgence in Asia, especially in China, underpinning the US dollar’s safe-haven appeal at gold’s expense. Further, the hawkish Fed’s outlook continues to propel the US Treasury yields northwards, adding to the weight on the non-yielding gold. Gold price also bears the brunt of hopes for progress on the Russia-Ukraine peace talks, as negotiators meet for another round of talks in Turkey from March 28-30. Looking ahead, the West’s likely ban on Russian gold reserves and headlines from the peace talks will be closely followed amid a data-light US docket this Monday.
Read: Coronavirus Update: Asia under attack once again, Shanghai locks down
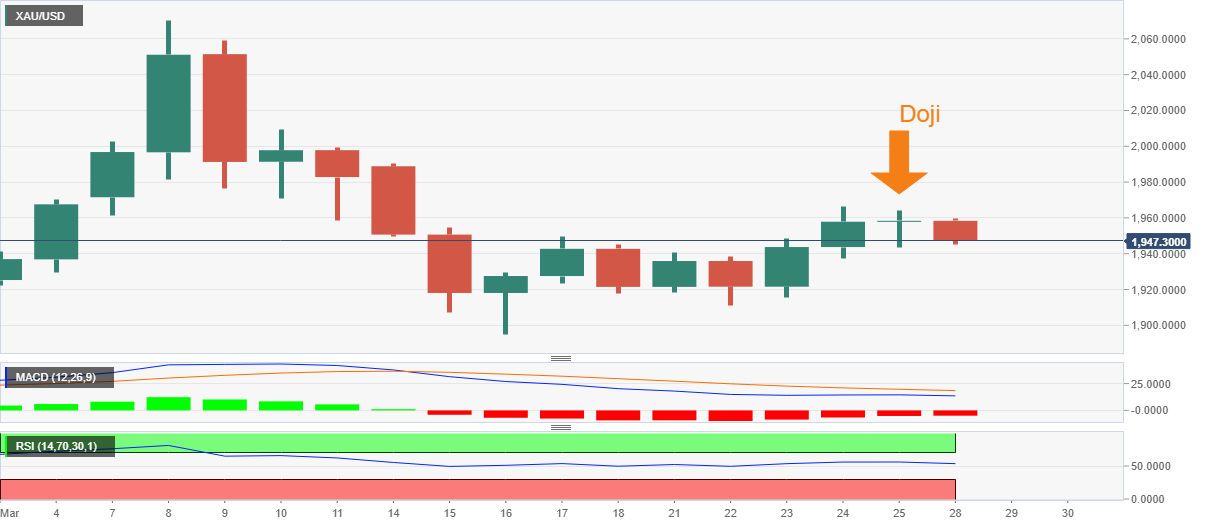
Gold (XAU/USD) takes offers to refresh intraday low around $1,945 while snapping a three-day uptrend during Monday’s Asian session.
In doing so, the yellow metal justifies Friday’s Doji candlestick, as well as firmer US dollar, but stays well inside a short-term bullish channel amid a light calendar.
It’s worth noting that the bond rout recently propelled the US dollar and weighed on the gold prices. That said, the yields for the benchmark 10-year bonds in the US and Japan recently reached the highest levels since 2019 and 2016 respectively. Underpinning the bond coupons are expectations that the global central bankers, led by the Fed, will portray aggressive monetary policy tightening to battle the reflation woes.
Also favoring the US dollar is the risk-off mood amid tensions between the West and Russia, as well as indecision over the Moscow-Kyiw talks. The comments from US President Joe Biden suggesting the indirect threat to the Russian President Vladimir Putin triggered risk-off mood during the early Asian, even as the White House and Germany tried to placate the fears.
On the same line was anxiety ahead of this week’s peace talks in Turkey as Ukrainian President Volodymyr Zelenskyy pushed for the progress of the Ukraine-Russia peace talks by saying, “We're ready to discuss neutrality and non-nuclear status if security guarantees are provided.” However, his statements like, “Ukraine to insist on sovereignty and territorial integrity with talks with Russia,” challenges the odds of success.
Furthermore, hawkish Fedspeak and record-high US inflation expectations also propel the US dollar buying. New York Fed President and an FOMC member John Williams said on Friday that the speed of interest rate hikes this year should be data-driven. However, multiple Fed policymakers before him have already signaled a faster rate hike trajectory amid inflation fears. That said, the US inflation expectations per the 10-year breakeven inflation rate per the St. Louis Federal Reserve (FRED) data refresh record top and also weigh on the market’s mood.
Looking forward, a light calendar during the initial weekdays can challenge the momentum traders but risk catalysts and NFP are likely to keep the markets volatile.
Technical analysis
Although Friday’s Doji candlestick on the daily chart suggests further declines of gold, an eight-day-old rising trend channel restricts the short-term downside of the metal.
Gold: Daily chart
That said, the 200-SMA adds strength to the stated channel’s support line near $1,925 whereas the 50-SMA around $1,937 restricts the immediate downside of the metal.
Meanwhile, recovery moves hinge on a clear upside break of the $1,975 hurdle comprising the stated channel’s upper line and the 50% Fibonacci retracement level of late February to March upside.
In a case where gold prices rally beyond $1,975, the odds of witnessing further upside towards the March 10 swing high near $2,010 can’t be ruled out.
Gold: Four-hour chart
_28032022-637840313023552689.png)
Author

Anil Panchal
FXStreet
Anil Panchal has nearly 15 years of experience in tracking financial markets. With a keen interest in macroeconomics, Anil aptly tracks global news/updates and stays well-informed about the global financial moves and their implications.


