Gold Price Forecast: XAU/USD grinds higher ahead of United States Inflation
- Gold price makes rounds to seven-month high as bulls take a breather.
- Mixed data from United States weighed on Treasury bond yields, US Dollar and propelled XAU/USD price.
- Upbeat signals from China also underpinned Gold price upside.
- Firmer US inflation data could probe XAU/USD bulls.

Gold price (XAU/USD) seesaws around the highest levels since June, close to $1,866 by the press time, after printing the biggest daily jump in five weeks the previous day.
The yellow metal cheered broad US Dollar selling, despite a mostly upbeat United States employment report, while posting the gains on Friday. The reason could be linked to the downbeat prints of the US ISM Services PMI as well as the Factory Orders that drowned the Treasury bond yields. On the contrary, price-positive updates from China helped the XAU/USD to remain firmer.
United States economics weigh on Treasury bond yields, propel Gold price
On Friday, United States Nonfarm Payrolls (NFP) rose by 223,000 in December compared to the market expectations of 200,000 and November's increase of 256,000 (revised from 263,000). Further details of the US December jobs report revealed that the Unemployment Rate declined to 3.5% from 3.6% in November and 3.7% expected. More importantly, the Average hourly earnings rose 0.3% in December versus 0.4% prior while the YoY figures eased to 4.6% from 4.8% in November.
Further, US ISM Services PMI slumped to the lowest levels in 31 months while suggesting a contraction in activities with 49.6 figures for December, versus the market expectations of 55 and 56.5 marked in November. On the same line, US Factory Orders also slumped, falling 1.8% in November after gaining 0.4% in October.
Despite the mixed readings of the key US data, Atlanta Federal Reserve bank president Raphael Bostic stated that the US economy is definitely slowing, which in turn drowned the key US Treasury bond yields and the US Dollar. That said, the US 10-year Treasury yields dropped 16 basis points (bps) to 3.56%, the lowest levels in three weeks, whereas the US Dollar Index (DXY) marked the biggest daily slump since November 11. Given the inverse relationship between the Gold price and the US Dollar, the yellow metal managed to refresh the multi-day high afterward.
China-linked optimism adds strength to XAU/USD upside
Considering China’s status as one of the world’s biggest Gold consumers, recent positive developments from the dragon nation seemed to also have underpinned the XAU/USD upside.
On Sunday, China opened air, land and sea borders for travelers after a three-year shutdown and marked the last effort to unlock the Covid-led economy. “After three years, mainland China opened sea and land crossings with Hong Kong and ended a requirement for incoming travelers to quarantine, dismantling a final pillar of a zero-COVID policy that had shielded China's 1.4 billion people from the virus but also cut them off from the rest of the world,” mentioned Reuters.
Additionally, the dragon nation’s recent piling of the Gold holdings also favors the XAU/USD bulls. As per the latest updates from the People's Bank of China (PBOC) website, China increased its holdings of gold by 30 tonnes in December to 2,010 tonnes. That said, Beijing previously added 32 tonnes in November. It should be noted that such high levels of Gold inflows were earlier spotted in September 2019 and October 2016.
US inflation is the key
The mixed US data and a slump in the United States Treasury bond yields recently pushed multiple Federal Reserve (Fed) officials to flag recession fears. However, a firmer US Consumer Price Index (CPI) for December, up for publishing on Thursday, won’t hesitate to shift the market’s focus on the Fed rate hike concerns and could propel the US Dollar, which in turn will challenge the Gold buyers.
Also read: Gold Price Weekly Forecast: Bulls retain control ahead of key US inflation data
Gold price technical analysis
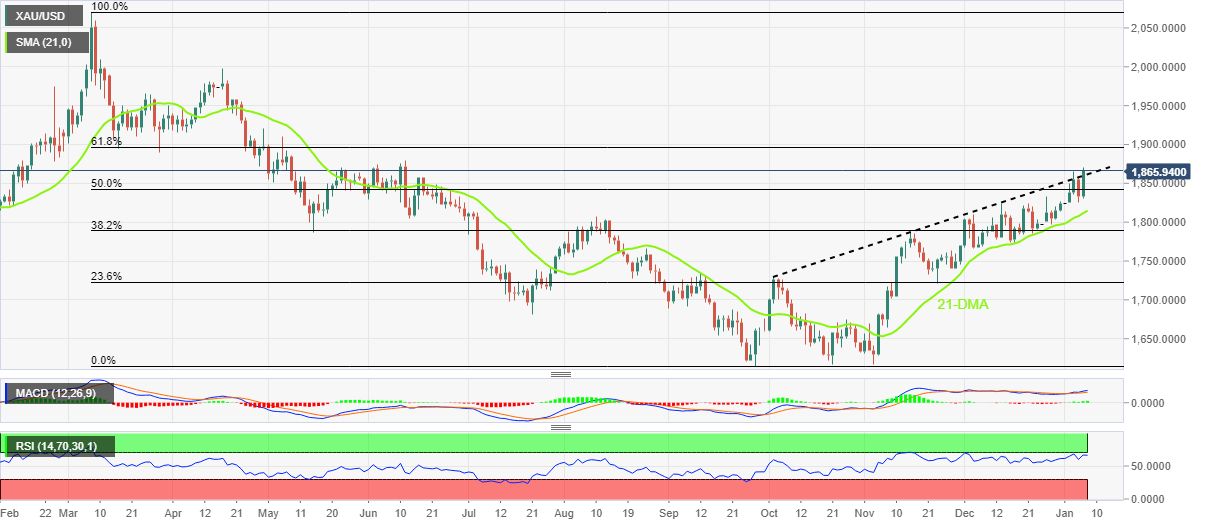
Gold price grinds near a multi-day high after crossing an upward-sloping resistance line from early October 2022, now immediate support around $1,860. The upside momentum also takes clues from the Moving Average Convergence and Divergence (MACD) indicator’s bullish signals and the firmer Relative Strength Index (RSI) line, placed at 14.
It’s worth noting, however, that the RSI line is near the overbought territory and also portrays a lower-high formation since early November, which in turn suggests a limited upside room for the XAU/USD.
As a result, June’s high near $1,880 and the 61.8% Fibonacci Retracement level of the Gold’s March-September 2022 downturn, near $1,897, quickly followed by the $1,900 threshold, gain the market’s attention.
In a case where the Gold price remains firmer past $1,900, multiple hurdles surrounding $1,915, $1,935 and $1,965 could challenge the buyers before directing them to the $2,000 psychological magnet.
Alternatively, a downside break of the $1,860 resistance-turned-support could drag the XAU/USD to the 50% Fibonacci retracement level of $1,842. However, the 21-Day Moving Average (DMA) and August month’s high, respectively around $1,811 and $1,807, could restrict the Gold price downside afterward.
Overall, Gold seems to have a limited upside room even if the bullish bias remains intact.
Gold price: Daily chart
Trend: Further upside expected
Author

Anil Panchal
FXStreet
Anil Panchal has nearly 15 years of experience in tracking financial markets. With a keen interest in macroeconomics, Anil aptly tracks global news/updates and stays well-informed about the global financial moves and their implications.


