Gold Price Forecast: XAU/USD subdued as the US dollar and US yields steal the show
- Gold prices consolidate recent losses as key SMA confluence test bears.
- US Treasury yields grind higher after refreshing two-year top on Fed rate hike bets.
- Virus woes escalate and so do geopolitical tensions concerning Russia-Ukraine, suggesting safe-havens to stay firmer.
- Second-tier US housing data to decorate calendar, Fed chatters are crucial ahead of next week’s FOMC.

Update: Gold (XAU/USD) is underperforming, on the margin, in Asia as US yields and the US dollar continues to mirror the markets foresight with regards to the forthcoming federal Reserve meeting next week.
Gold (XAU/USD) prices keep the bounce off weekly low at around $1,815, up 0.05% intraday during Wednesday’s Asian session.
The yellow metal dropped to the lowest since December 11 the previous day as Fed Fund Futures propelled US Treasury yields and the US Dollar Index (DXY). However, geopolitical fears and downbeat sentiment concerning the South African covid variant, known as Omicron, joined US data to pare the losses.
Read: Gold Price Forecast: Poised to resume its decline amid inflation concerns
The 2-year government bond yields rose from 1.00% to 1.063%, and the 10-year government bond yields rose from 1.80% to 1.89% over the past 24-hours or so. At the time of writing, DXY is testing the psychological 95.80 level. This is a significant area as per the following technical analysis below.
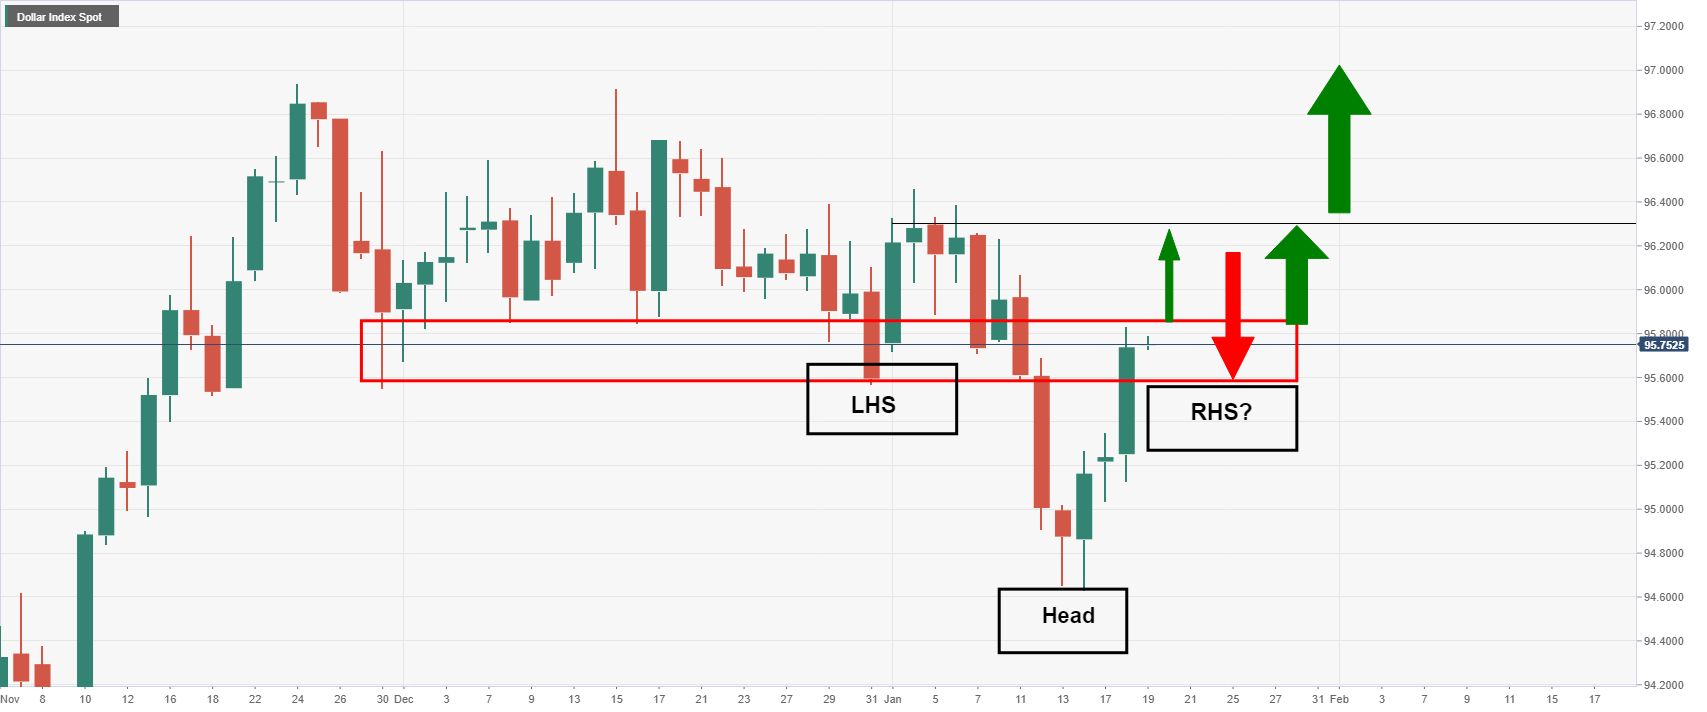
There could be an inverse head and shoulders forming which would be a bullish technical picture for the greenback around the Fed meeting next week. A higher US dollar would be expected to keep the gold bugs in check and the yellow metal on the backfoot.
End of update
That said, the DXY dropped the most in 12 days on Tuesday after the Fed Fund Futures cited heavy chances of witnessing the above 1.0% Fed rate during early 2023. With that, the US Treasury bond yields for the 10-year and 2-year tenures rose to the highest levels since early 2020, which in turn weighed on the equities, commodities and Antipodeans. It should be noted that the stated US bond coupons recently dwindle around the highest levels since January 2020 with the benchmark 10-year yields around 1.87% by the press time.
Even so, downbeat New York Fed manufacturing gauge joined escalating fears of a war between Russia and Ukraine to keep the gold buyers hopeful. The NY Empire State Manufacturing Index slumped to negative for the first time in two years in December, -0.7 versus 25.7 expected and 31.9 prior, whereas US NAHB Housing Market Index eased to 83 versus 84 market forecasts and previous readouts.
Also acting as a risk-negative catalyst is the record high covid cases in Australia’s most populous state New South Wales (NSW) as well as worsening virus conditions in Japan and China.
To sum up, escalating chatters over the Fed rate hikes may underpin US dollar strength and can weigh on gold prices. However, other challenges to the risk appetite mentioned above might defend the gold buyers amid a light calendar in the US and Fedspeak blackout.
Read: Fed preview: End of money printing brrrrr – Four 25bp rate hikes this year and QT in September
Technical analysis
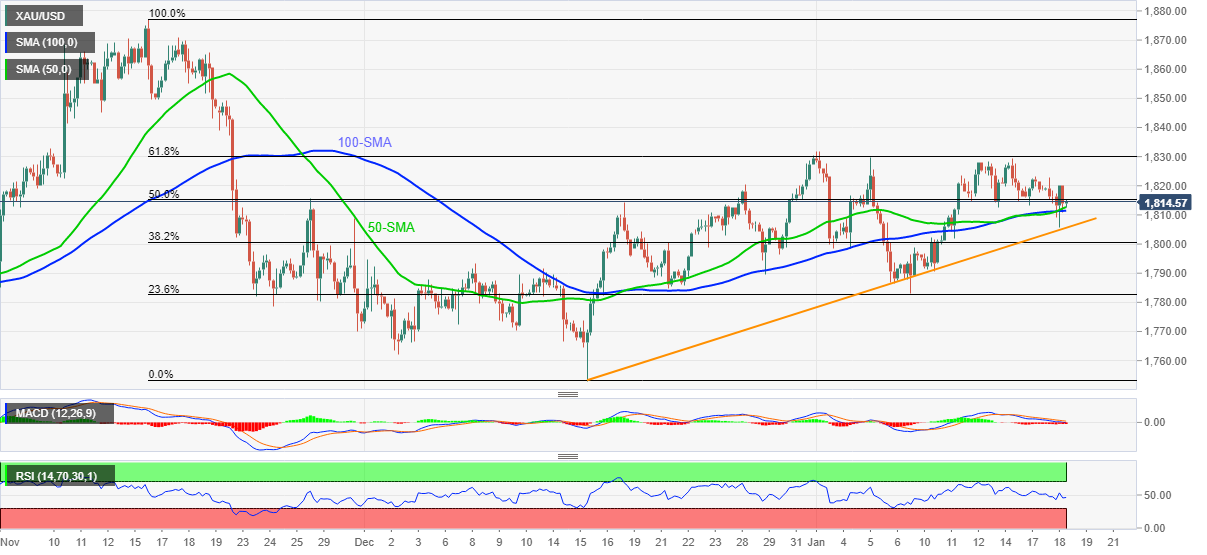
As gold buyers lurk around a five-week-old ascending trend line, near $1,805 at the latest, the yellow metal’s recent rebound once again target the 61.8% Fibonacci retracement of November-December downside, near $1,830.
Given the easing bearish bias of the MACD and RSI recovery, not to forget the bull cross of the 50-SMA to 100-SMA, the gold prices are likely to overcome the $1,830 hurdle this time.
However, tops marked in July and September close to $1,834 acts as an extra hurdle to the north before fueling the bullion towards the $1,850 intermediate resistance and November’s peak of $1,877.
Alternatively, a confluence of the stated SMA around $1,811 acts as immediate support before directing gold sellers toward the stated support line near $1,805.
In a case where gold prices decline past $1,805, the $1,800 threshold and 23.6% Fibo. level close to $1,782 should be watched carefully for the precious metal’s further downside.
To sum up, gold buyers regain upside momentum and are likely to overcome short-term hurdle this time.
Gold: Four-hour chart
Trend: Recovery expected
Author

Anil Panchal
FXStreet
Anil Panchal has nearly 15 years of experience in tracking financial markets. With a keen interest in macroeconomics, Anil aptly tracks global news/updates and stays well-informed about the global financial moves and their implications.


