Gold Price Forecast: XAU/USD faces a wall of resistance near $1,970 – Confluence Detector
- Gold Price retreats from intraday high but stays mildly bid for the second consecutive week.
- Sluggish US Dollar, unimpressive market and mixed China data prod XAU/USD traders.
- Multiple hurdles challenge Gold buyers near $1,970 as yields dribble.

Gold Price (XAU/USD) lacks clear directions even as bulls have an upper hand for the second consecutive week. In doing so, the precious metal depicts the sluggish markets amid an absence of the Federal Reserve (Fed) talks and a lack of major data on the calendar. It’s worth noting that upbeat China PMI jostles with mixed foreign trade numbers while the recent pick-up in the July Fed rate hike also challenges the Gold buyers.
Meanwhile, an increase in the US Treasury’s bond issuance and cautious optimism surrounding China joins no rate hike expectations from June FOMC to keep the Gold bulls on the table.
With this in mind, second-tier US data/events may entertain the Gold traders ahead of Friday’s China inflation numbers.
Also read: Gold Price Forecast: XAU/USD appears ‘sell the bounce’ trade below 21 DMA barrier
Gold Price: Key levels to watch
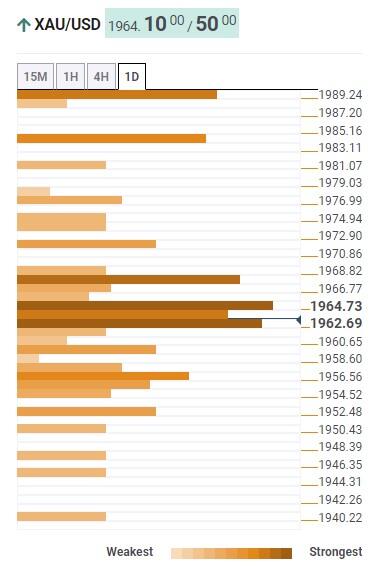
As per our Technical Confluence Indicator, the Gold Price prods a jungle of resistances surrounding the $1,970 level.
Among them, a convergence of the Fibonacci 38.2% in one-week and multiple short-term moving averages join the middle band of the Bollinger on 15-minute chart to highlight $1,966 as the immediate upside hurdle.
Following that, Pivot Point one-day R1, upper band of the Bollinger on hourly play and the Fibonacci 23.6% in one-month together highlight $1,968 as another important resistance for the Gold Price.
Should the quote manage to remain firmer past $1,968, the $1,970 round figure may act as an extra filter towards the north before directing the XAU/USD towards a convergence of the previous weekly high and upper band of the Bollinger on four-hour chart, near $1,985.
Meanwhile, 200-HMA, 10-DMA and Pivot Point one-day S1 together highlight $1,955 as immediate support to watch for the Gold bears to conquer.
Even so, Fibonacci 61.8% in one week can act as an extra filter towards the north near $1,952 before welcoming the Gold sellers.
Here is how it looks on the tool
About Technical Confluences Detector
The TCD (Technical Confluences Detector) is a tool to locate and point out those price levels where there is a congestion of indicators, moving averages, Fibonacci levels, Pivot Points, etc. If you are a short-term trader, you will find entry points for counter-trend strategies and hunt a few points at a time. If you are a medium-to-long-term trader, this tool will allow you to know in advance the price levels where a medium-to-long-term trend may stop and rest, where to unwind positions, or where to increase your position size
Author

Anil Panchal
FXStreet
Anil Panchal has nearly 15 years of experience in tracking financial markets. With a keen interest in macroeconomics, Anil aptly tracks global news/updates and stays well-informed about the global financial moves and their implications.

















