Gold Price Forecast: XAU/USD eyes deeper losses if $1805 support caves in – Confluence Detector


  • Gold price starts August in the red amid a rebound in risk appetite ahead of ISM.
  • US infrastructure bill optimism, DYX weakness fails to offer reprieve to gold bulls.
  • Gold: Bulls hesitate as focus shift to NFP.

The downbeat tone around gold price remains unabated this Monday, as the bears extended their control after Friday’s steep drop. The progress on the US infrastructure bill and broad US dollar weakness fail to offer any reprieve to the bulls, as gold price heads towards the $1800 mark. The risk-on rally in the global stocks combined with stabilizing Treasury yields weighs negatively on gold price. Investors also ignore the mounting tensions surrounding the Delta covid variant spread globally. Attention now turns towards US ISM Manufacturing PMI and corporate earnings reports for fresh trading impulse.

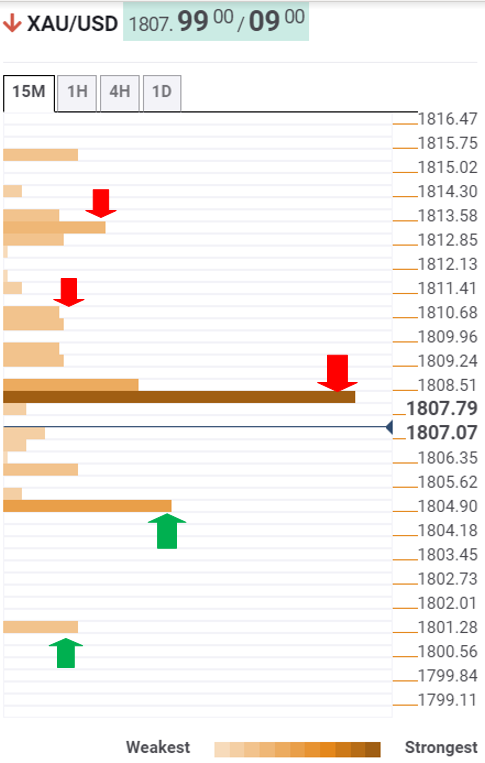
Gold Price: Key levels to watch

The Technical Confluences Detector shows that gold has breached powerful support at $1808, which was the convergence of the Fibonacci 38.2% one-month, SMA50 four-hour and SMA10 one-day.

Therefore, sellers now target the $1805 support, where the Bollinger Band one-hour Lower lies.

The next relevant cushion awaits at the SMA100 one-day at $1801, below which a drop towards the previous week's lows around $1790 cannot be ruled out.

If the buyers recapture the abovementioned key support at $1808, which has now turned into resistance, gold price could seek a retest of the SMA100 four-hour at $1810.

Further up, $1813 could act as a stiff resistance. At that point, the SMA100 one-hour coincides with the previous high four-hour and SMA5 four-hour.

The Fibonacci 23.6% one-day at $1816 could be the next target of interest for gold bulls.

Here is how it looks on the tool     

  fxsoriginal

About Technical Confluences Detector

The TCD (Technical Confluences Detector) is a tool to locate and point out those price levels where there is a congestion of indicators, moving averages, Fibonacci levels, Pivot Points, etc.  If you are a short-term trader, you will find entry points for counter-trend strategies and hunt a few points at a time. If you are a medium-to-long-term trader, this tool will allow you to know in advance the price levels where a medium-to-long-term trend may stop and rest, where to unwind positions, or where to increase your position size.


Share: Feed news

Information on these pages contains forward-looking statements that involve risks and uncertainties. Markets and instruments profiled on this page are for informational purposes only and should not in any way come across as a recommendation to buy or sell in these assets. You should do your own thorough research before making any investment decisions. FXStreet does not in any way guarantee that this information is free from mistakes, errors, or material misstatements. It also does not guarantee that this information is of a timely nature. Investing in Open Markets involves a great deal of risk, including the loss of all or a portion of your investment, as well as emotional distress. All risks, losses and costs associated with investing, including total loss of principal, are your responsibility. The views and opinions expressed in this article are those of the authors and do not necessarily reflect the official policy or position of FXStreet nor its advertisers. The author will not be held responsible for information that is found at the end of links posted on this page.

If not otherwise explicitly mentioned in the body of the article, at the time of writing, the author has no position in any stock mentioned in this article and no business relationship with any company mentioned. The author has not received compensation for writing this article, other than from FXStreet.

FXStreet and the author do not provide personalized recommendations. The author makes no representations as to the accuracy, completeness, or suitability of this information. FXStreet and the author will not be liable for any errors, omissions or any losses, injuries or damages arising from this information and its display or use. Errors and omissions excepted.

The author and FXStreet are not registered investment advisors and nothing in this article is intended to be investment advice.

Recommended content


Recommended content

Editors’ Picks

AUD/USD: Extra gains in the pipeline above 0.6520

AUD/USD: Extra gains in the pipeline above 0.6520

AUD/USD partially reversed Tuesday’s strong pullback and regained the 0.6500 barrier and beyond in response to the sharp post-FOMC pullback in the Greenback on Wednesday.

AUD/USD News

EUR/USD meets support around 1.0650

EUR/USD meets support around 1.0650

EUR/USD managed to surpass the key 1.0700 barrier in response to the intense retracement in the US Dollar in the wake of the Fed’s interest rate decision and Chair Powell’s press conference.

EUR/USD News

Gold surpasses $2,300 as Dollar tumbles

Gold surpasses $2,300 as Dollar tumbles

The precious metal maintains its constructive stance and trespasses the $2,300 region on Wednesday after the Federal Reserve left its FFTR intact, matching market expectations.

Gold News

Bitcoin price reclaims $59K as Fed leaves rates unchanged

Bitcoin price reclaims $59K as Fed leaves rates unchanged

The market was at the edge of its seat on Wednesday to see whether the US Federal Reserve (Fed) would cut interest rates during the Federal Open Market Committee (FOMC) meeting. 

Read more

The market welcomes the Fed's statement

The market welcomes the Fed's statement

The market has welcomed the Fed statement, and the S&P 500 is higher in its aftermath, the dollar is lower and Treasury yields are falling. There is still only one cut priced in by the Fed.

Read more

Forex MAJORS

Cryptocurrencies

Signatures