Gold Price Forecast: XAU/USD drops from $1,670 amid volatile DXY, BOJ’s intervention gossips escalate
- Gold price has declined sharply after testing the $1,670.00 hurdle amid a wild DXY.
- Market sentiment is highly positive as S&P500 futures have extended their gains.
- The odds for a hawkish Fed policy have resurfaced firmly above 94%.

Gold price (XAU/USD) has picked offers while attempting to cross the critical hurdle of $1,670.00 in the Tokyo session. The precious metal has sensed decent selling pressure as the US dollar index (DXY) has turned highly volatile amid gossip over the Bank of Japan (BOJ)’s intervention in the FX markets to support the Japanese yen.
The US dollar index (DXY) has revolved in a 111.47-112.27 range. It is likely to remain volatile until clarity over BOJ’s intervention as Japan’s top currency diplomat Masato Kanda has denied commenting on revealing any intervention plans.
Meanwhile, S&P500 futures have extended their upside journey following Friday’s positive sentiment in early Asia. Simultaneously, the returns on US government bonds have dented further despite a recovery in bets on hawkish Federal Reserve (Fed) policy. The 10-year US Treasury yields have dropped further to 4.21%. At the same time, the probability of a 75 basis point (bps) rate hike by the Fed carries more than 94% on the CME FedWatch tool at the press time.
Going forward, the US S&P PMI data will be of utmost importance. Per the market consensus, the Manufacturing PMI will decline to 51.2 vs. the prior release of 52.0 while the Services PMI will slash to 49.2 from 49.3 reported earlier.
Gold technical analysis
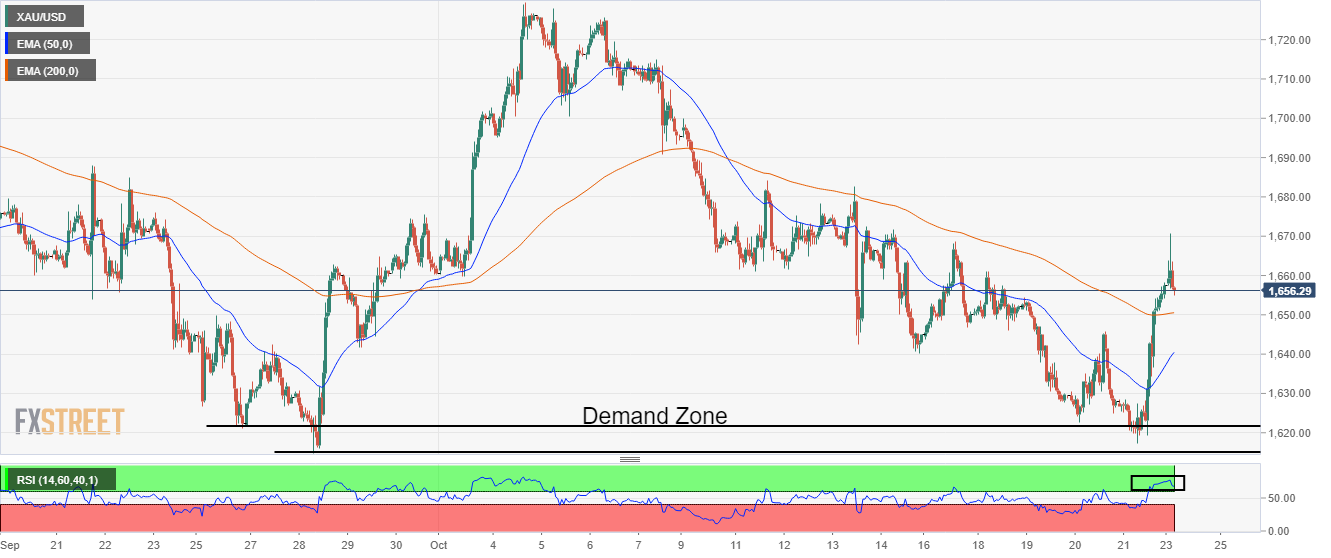
On an hourly scale, the Gold price has witnessed a stellar buying interest after testing the demand zone in a $1,614.85-1,621.60 range. The precious metal has crossed the 50- and 200-Exponential Moving Averages (EMAs) at $1,637.50 and $1,660.00, respectively.
It is worth noting that the 50-and 200-EMAs have not delivered a bull cross yet, which shows the strength of the gold bulls. Also, the Relative Strength Index (RSI) (14) has shifted into the bullish range of 60.00-80.00, which indicates more upside ahead.
Gold hourly chart
Author

Sagar Dua
FXStreet
Sagar Dua is associated with the financial markets from his college days. Along with pursuing post-graduation in Commerce in 2014, he started his markets training with chart analysis.


