Gold Price Forecast: XAU/USD downside remains exposed towards $1,712 – Confluence Detector
- Gold price consolidates near monthly lows, not out of the woods yet.
- US dollar drops with yields as investors reposition ahead of US jobs report.
- XAU/USD faces a wall of strong resistance levels, downside remains favored.

Gold price is treading water near monthly lows, looking to extend the bearish streak seen so far this week. Investors refrain from placing any aggressive bets on the bright metal ahead of the all-important US employment data. In light of strong US Consumer Confidence data, encouraging jobs data could bolster the expectations of a 75 bps Fed rate hike in September. This could revive the US dollar rally, keeping the downtrend intact in the bullion. Additionally, the Eurozone inflation data could seal in an outsized ECB rate hike next week, exacerbating the pain in the non-interest-bearing gold. The US NFP data will hold the key ahead of the next inflation report.
Also read: Gold Price Forecast: Will US ADP deepen the pain for XAU/USD bulls?
Gold Price: Key levels to watch
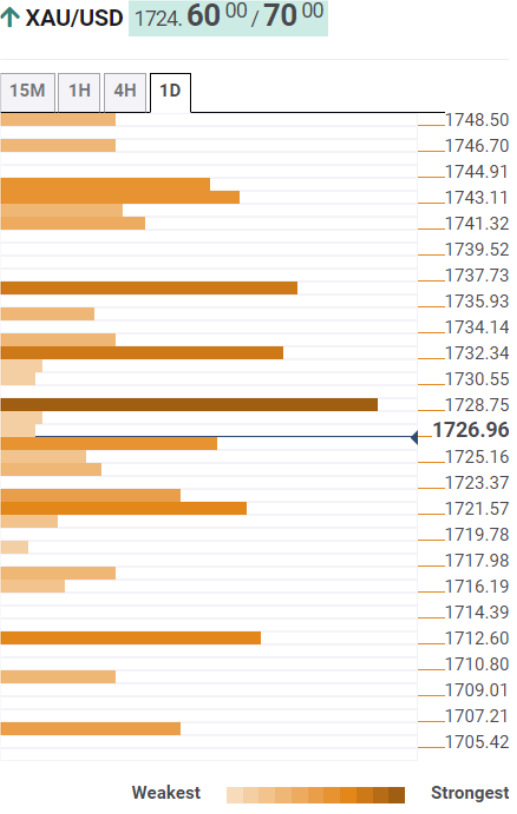
The Technical Confluence Detector shows that the gold price is facing stiff resistance at $1,729, where the Fibonacci 38.2% one-day and the previous week’s low merge.
A sustained break above the latter will threaten the Fibonacci 38.2% one-month at $1,732. The next upside barrier is aligned at $1,736, the confluence of the Fibonacci 23.6% one-week and pivot point one-day R1.
Buying resurgence could propel XAU/USD towards powerful resistance around $1,742, the intersection of the SMA50 four-hour and Fibonacci 38.2% one-week.
Should sellers wake up from the slumber, the downside could be reopened towards the monthly lows of $1,720, below which the pivot point one-day S1 at $1,717 will be challenged.
The Fibonacci 23.6% one-month at $1,712 will be the line in the sand for XAU bulls before attacking the $1,700 psychological level.
Here is how it looks on the tool
About Technical Confluences Detector
The TCD (Technical Confluences Detector) is a tool to locate and point out those price levels where there is a congestion of indicators, moving averages, Fibonacci levels, Pivot Points, etc. If you are a short-term trader, you will find entry points for counter-trend strategies and hunt a few points at a time. If you are a medium-to-long-term trader, this tool will allow you to know in advance the price levels where a medium-to-long-term trend may stop and rest, where to unwind positions, or where to increase your position size.
Author

Dhwani Mehta
FXStreet
Residing in Mumbai (India), Dhwani is a Senior Analyst and Manager of the Asian session at FXStreet. She has over 10 years of experience in analyzing and covering the global financial markets, with specialization in Forex and commodities markets.


