Gold Price Forecast: XAU/USD bears lurking below counter-trendline
- Gold price rallies on US CPI and soft US dollar, but bears are lurking.
- Gold price is eating into the support structure on the backside of the counter-trendline.

Gold price rallied towards new all-time highs with there not being any surprise in the US Consumer Price Index. XAU/USD traveled from a low of $2,025 and reached a high of $2,048 on the day.
The US Dollar ended the day lower amid lower US yields. The US Dollar Index (DXY), which measures the greenback vs. a basket of currencies, including the Aussie, ended around 101.40, as it remains above the key support of 101.00. The US 10-year Treasury yield settled at 3.43% and the 2-year at 3.90%, after reversing from near 4.10%.
Consumer inflation in the US measured by the Consumer Price Index (CPI) ticked lower in April to 4.9% from 5% in March. The Core CPI slowed down from 5.6% in March to 5.5% in April. Numbers came mostly in line with expectations. The Fed Funds rate at 5.00%-5.25% is now above the annual CPI.
´´The gravitational pull in gold markets should continue to support higher prices over the coming months,´´ analysts at TD Securities argued.
´´While CTA trend followers remain 'max long', discretionary trader interest has just started to kick off. However, given positioning within this cohort tends to lag rates market expectations for Fed funds pricing, we expect discretionary traders to deploy their hoard of dry powder in support of new all-time highs.´´
With respect to the sentiment surrounding the Fed, analysts at Brown Brothers Harriman noted that the ´´easing expectations are starting to get pared back.´´
´´At the start of last week, swaps market was pricing in a Fed Funds range between 4.0-4.25% in 12 months. Earlier, it was as low as 3.5-3.75% but now it's back in the 3.75-4.0% range in 12 months. Three cuts by year-end were fully priced in at the start of this week but the odds of a third hike have fallen to around 60% currently,´´ the analysts explained.
´´That said, market expectations of a Fed pivot are misguided and must be repriced. Fed officials are likely to continue pushing back against this dovish take but it will really be up to the data.´´
Meanwhile, markets are also concerned over the ongoing banking stress and the debt ceiling debacle. Analysts at TD Securities argued that there ´´will remain in focus, and continue to generate headwinds for the USD, especially as the global growth outlook dusts off last year’s stagflationary conditions.´´
´´Overall,´´ the analysts explained, ´´ the data continue to support our view that a new bull market in gold may have just kicked off.´´
Gold technical analysis
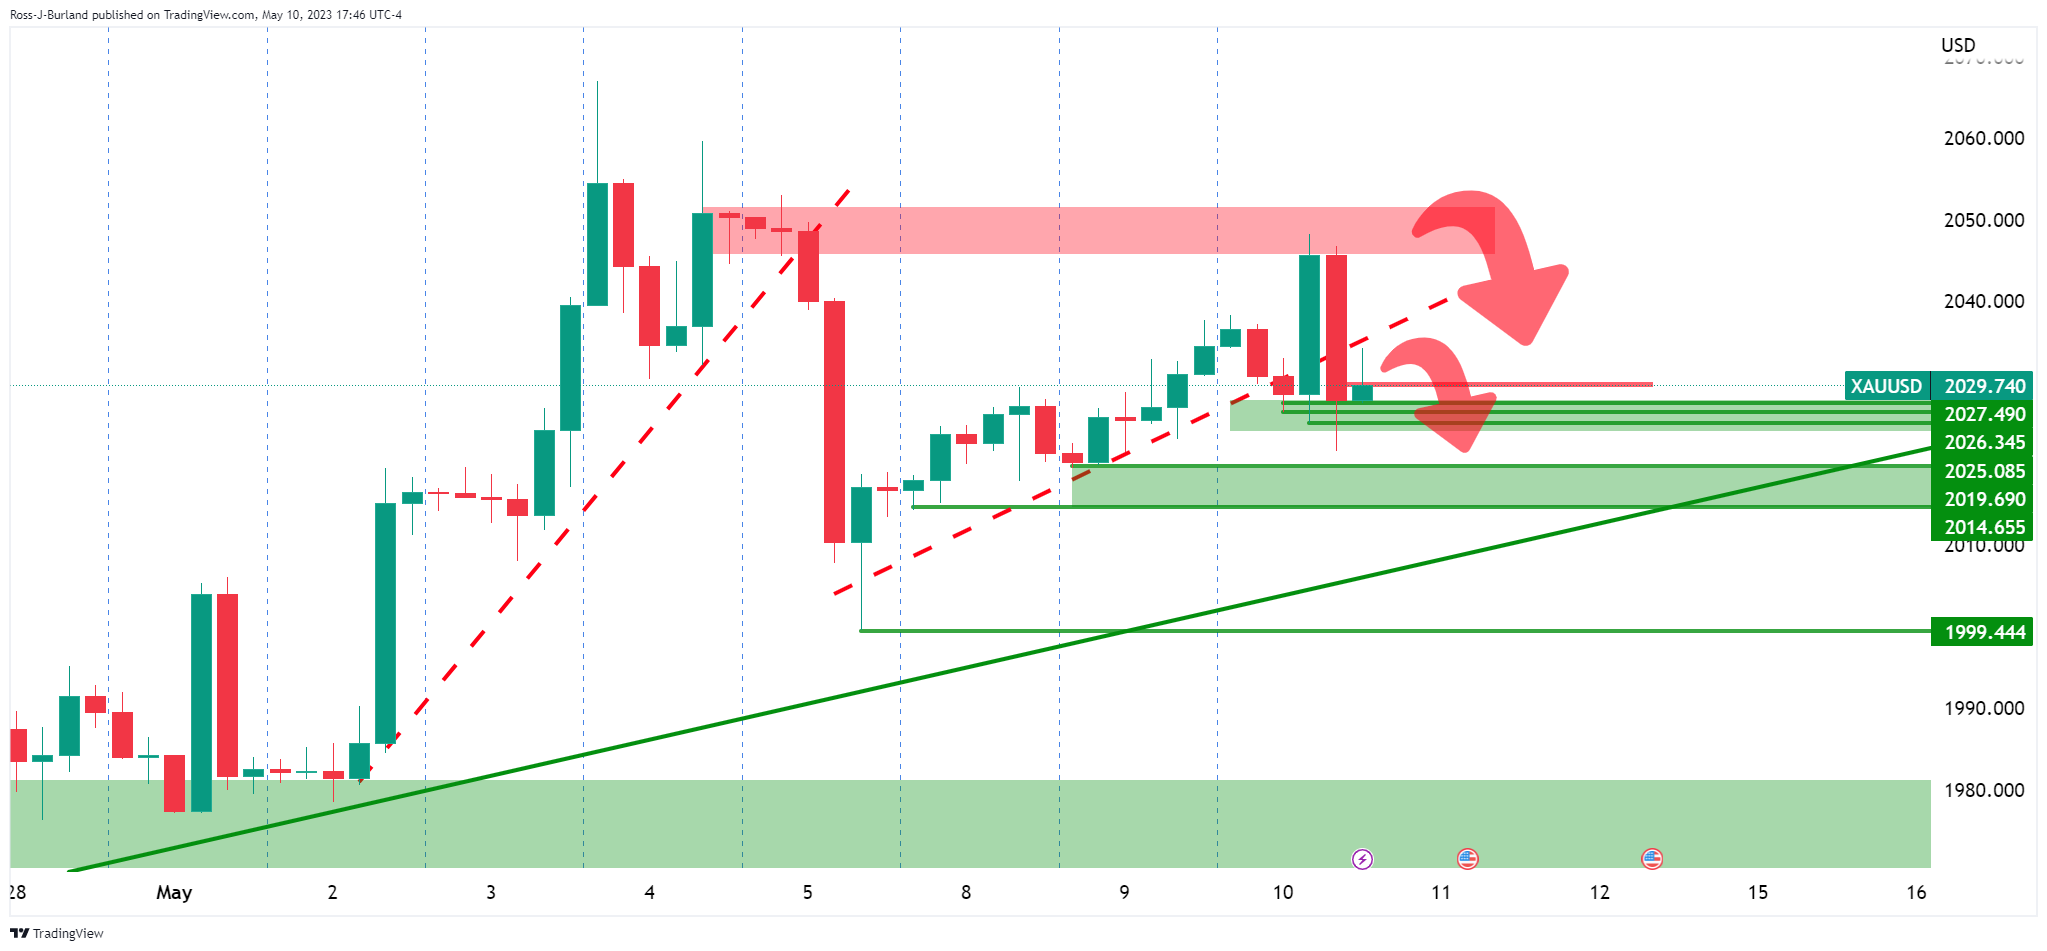
The Gold price 4-hour chart´s tweezer top and placement below the prior micro trendline supports, on the backside of those trends, leaves the outlook bearish for a run towards the bullish trendline support:
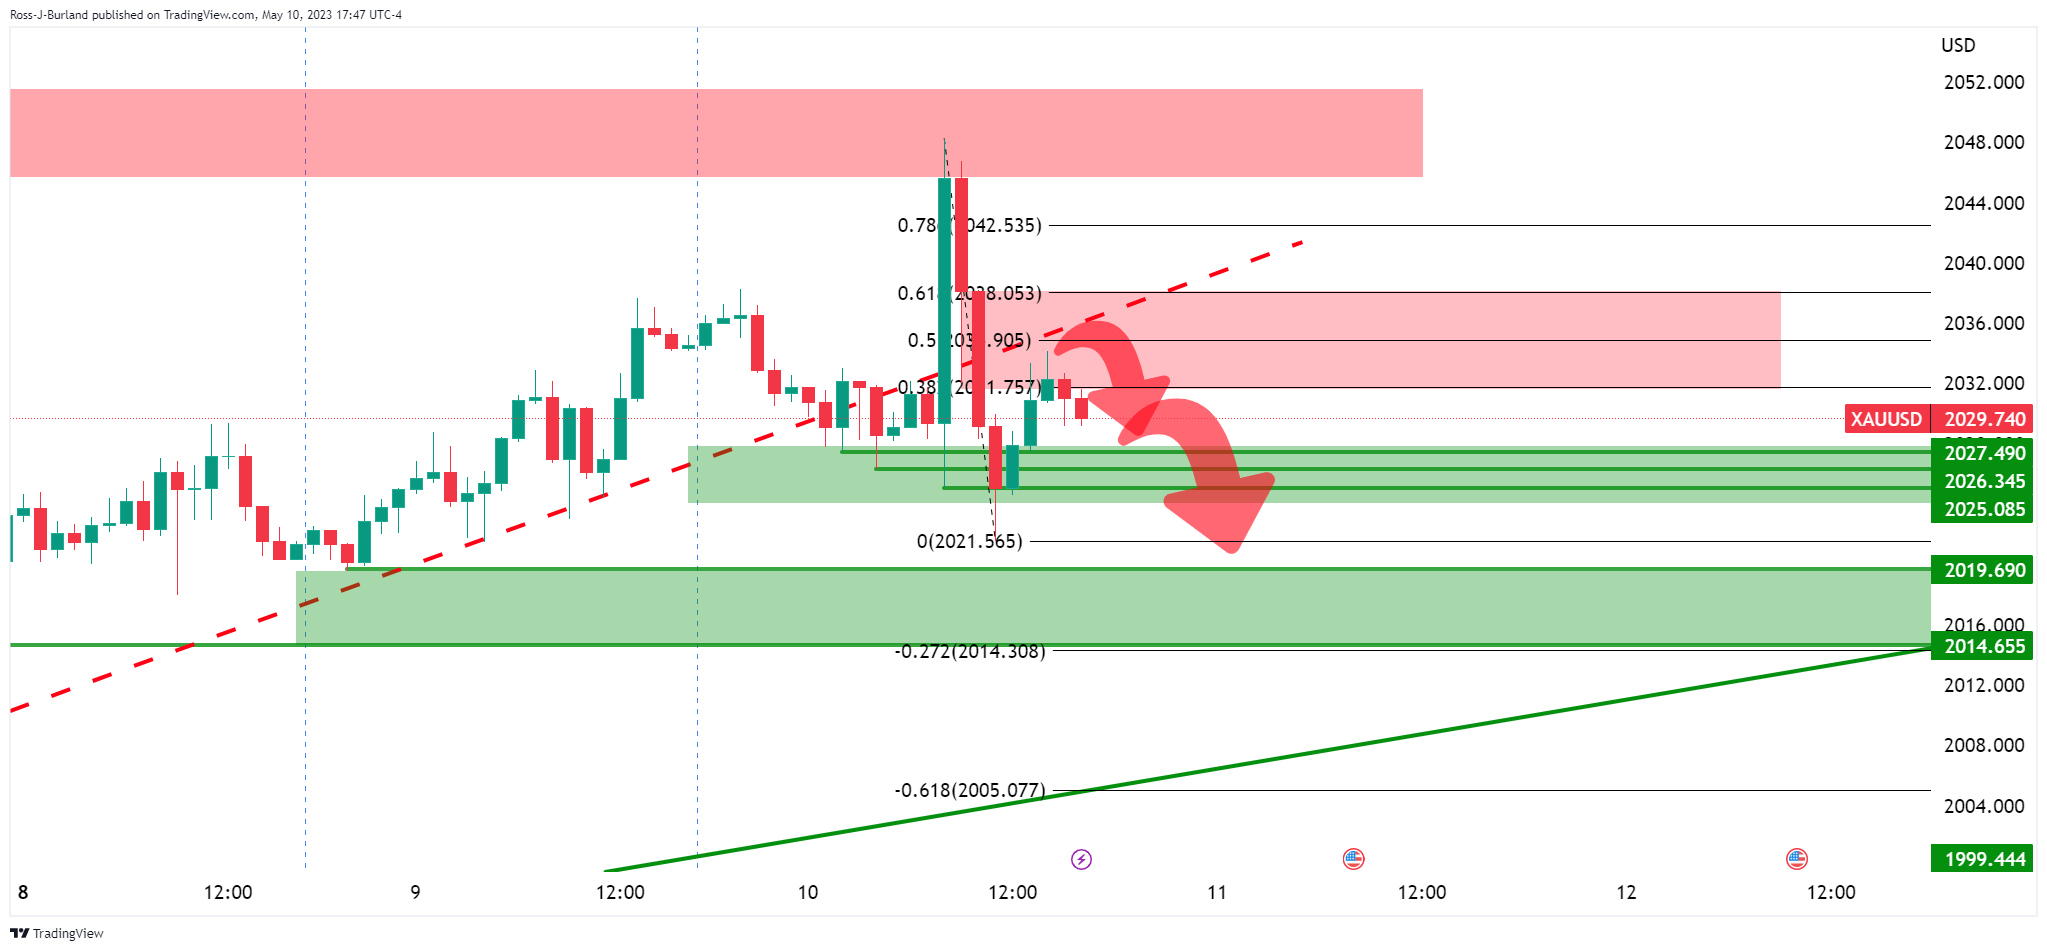
The hourly chart, above, shows that the price is penetrating the structure around $2,025 and the correction is decelerating. This could lead to further commitments from the bears in the coming sessions.
Author

Ross J Burland
FXStreet
Ross J Burland, born in England, UK, is a sportsman at heart. He played Rugby and Judo for his county, Kent and the South East of England Rugby team.


