Gold Price Forecast: XAU/USD bears are lurking below $1,785
- Gold is under pressure on the daily chart, flat in Asia ahead of the FOMC minutes.
- The price would be expected to move below daily support so long as the resistance holds near the 50% mean reversion around $1,785.

Gold is flat on the day trading at around $1,776.50 and sticking to a tight range of between $1,773.91 to a high of $1,776.85. The yellow metal fell due to rising Treasury yields weighed on investor appetite. A slightly stronger US dollar was also a headwind for investor demand. The greenback is currently steady as investors await the release of the minutes of the Federal Open Market Committee issues minutes from its meeting of July 26-27.
The US central bank raised its benchmark overnight interest rate by 225 basis points to tame high inflation. The minutes could offer clues on further interest rate hikes. The Fed is expected to raise its policy rate by another 50 or 75 basis points at its next meeting on Sept. 20-21. US Treasury yields have been firm as a consequence and also due to the recession worries and despite nascent signs of a slowdown in inflation.
Several Fed policymakers have spoken of the need for continued rate hikes despite the lower-than-expected outcome of last week's Consumer Price Index. "Fed officials have no choice but to sound tough in the face of a very, very tight labour market and far too high inflation," Kit Juckes, the head of FX strategy at Societe Generale argued. "It's hard to build a compelling case to sell the dollar in that world."
Meanwhile, ''odds of a short squeeze in gold are notably declining,'' the analysts at TD Securities argued. ''However, our CTA positioning estimates suggest that a trend followers buying program contributed to lower rates over the past month, as algos were forced to cover shorts. While this supported higher prices in gold, the bar is razor thin for algorithmic trend followers to add to selling pressures in US10y Treasuries once more,'' the analysts said.
''This should further sap appetite to buy the yellow metal, while the bar for additional short covering rises further. Meanwhile, Shanghai traders are also likely to appear on the offer, particularly amid a weakening CNY. Gold prices are vulnerable, considering we see signs that gold sellers are lurking. Ultimately, prop traders are still holding a massive amount of complacent length, suggesting we have yet to see capitulation in gold, which argues that the pain trade remains to the downside.''
Gold technical analysis
Gold is carving out a bearish case below the counter trendline on the daily chart as follows:
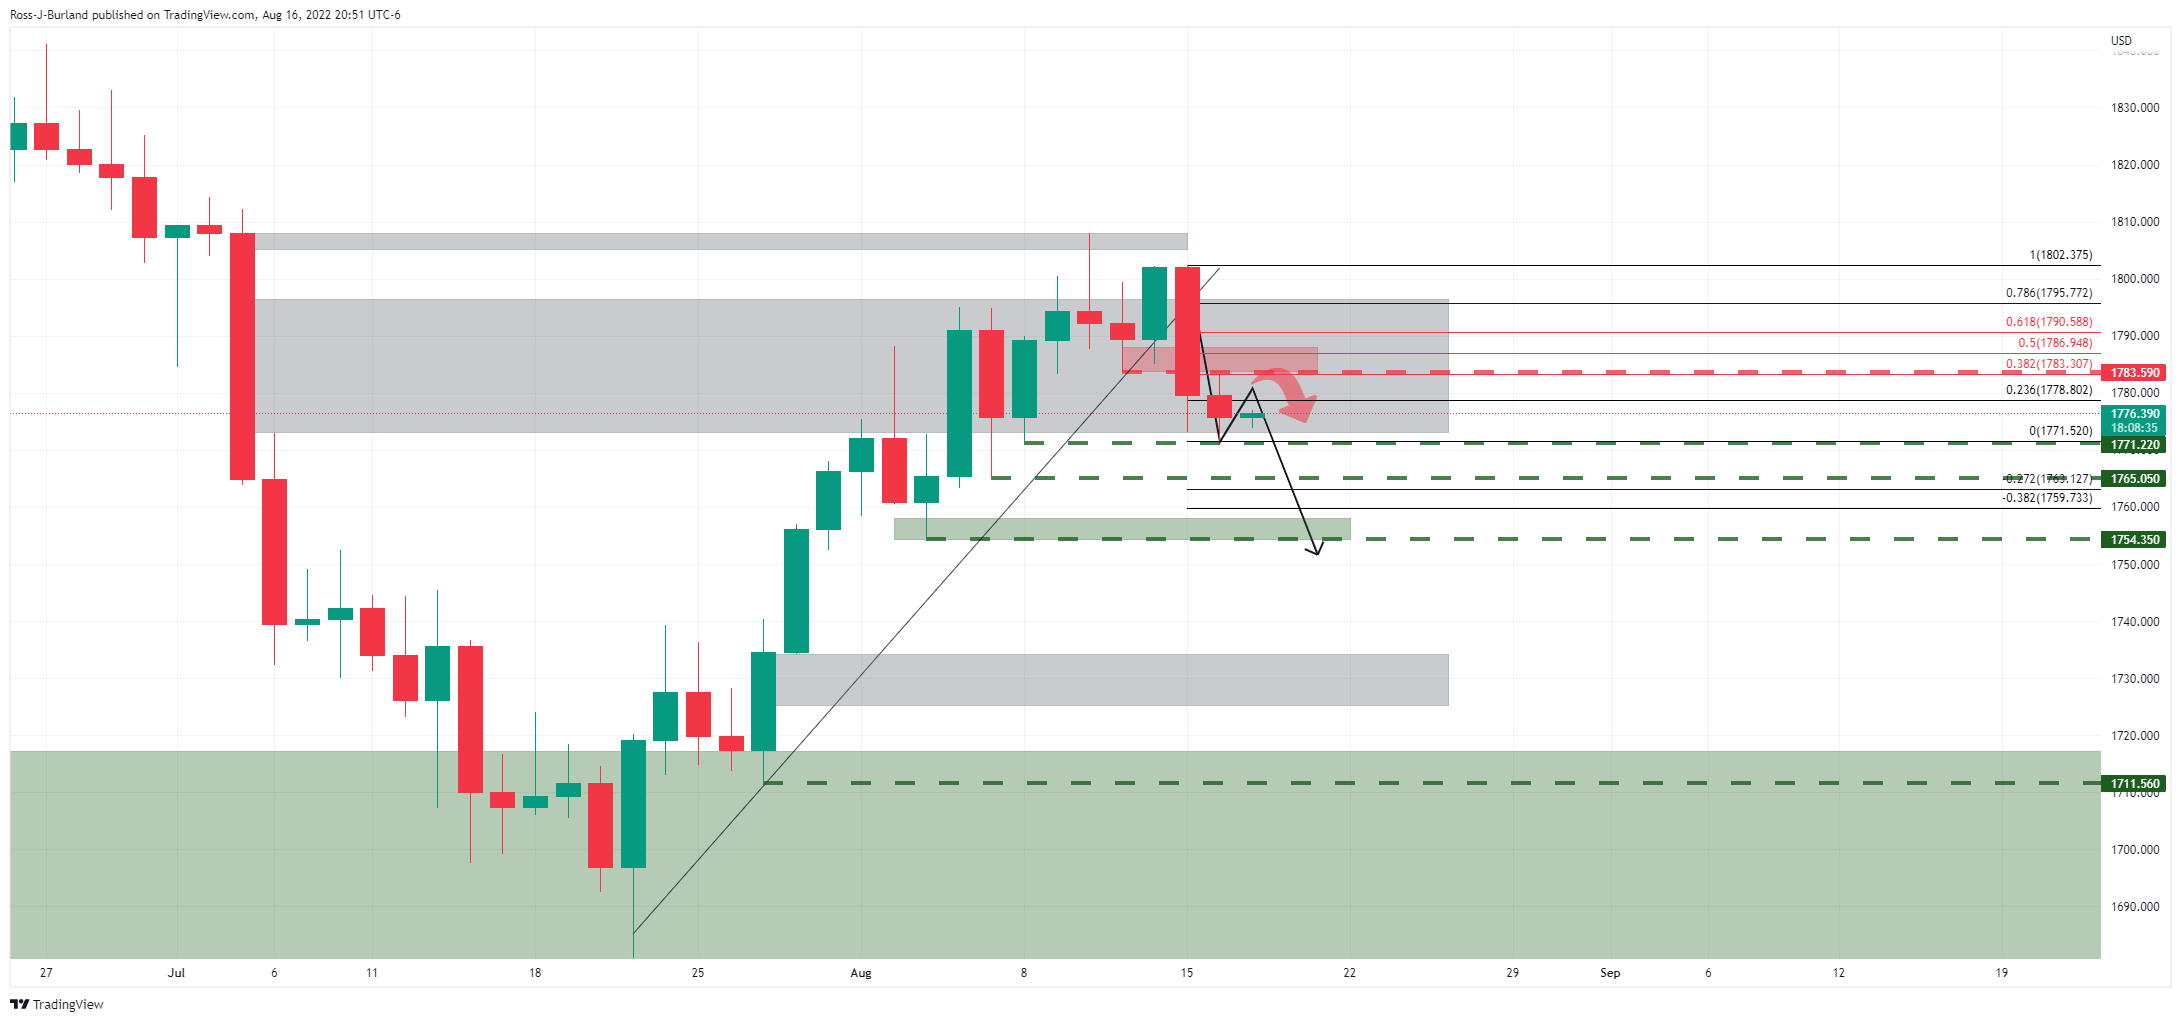
The price has stalled at a prior support level but would be expected to move below it so long as the resistance holds near the 50% mean reversion around $1,785.
Author

Ross J Burland
FXStreet
Ross J Burland, born in England, UK, is a sportsman at heart. He played Rugby and Judo for his county, Kent and the South East of England Rugby team.