Gold Price Forecast: XAU/USD battles key hurdle to $1,817 – Confluence Detector
- Gold cheers risk-off mood, extends bounce off three-week low.
- US Trader’s return, virus woes and heavy yields to keep buyers hopeful.
- Gold Price Forecast: New COVID-19 variant boosts XAU/USD, hawkish Fed to cap gains

Gold (XAU/USD) pokes intraday high to mark the heaviest daily run-up in a week, up 0.55% around $1,799 heading into Friday’s European session. The yellow metal benefits from the plunge in US Treasury yields to extend the previous day’s recovery moves, mainly due to the covid variant woes.
That said, the 10-year bond coupon drops the most since July and its two-year counterpart marking the heaviest fall since March 2020 amid fears over the COVID-19 variant. The fall in the Treasury yields also weigh on the US Dollar Index (DXY), down 0.09% near 96.68 by the press time. It’s worth noting that the woes concerning the coronavirus strain don’t allow equities to benefit from the softer yields and receding chatters over the Fed rate hike.
With the US traders returning from the Thanksgiving Day holiday, although for a smaller session, the risk-off mood may get an additional boost, which in turn could propel the gold prices towards the north of the $1,800 hurdle. However, Fed policymakers haven’t yet stepped back from the rate hike calls, neither did inflation numbers. As a result, the gold buyers will need a stronger push to cross the immediate resistance.
Gold Price: Key levels to watch
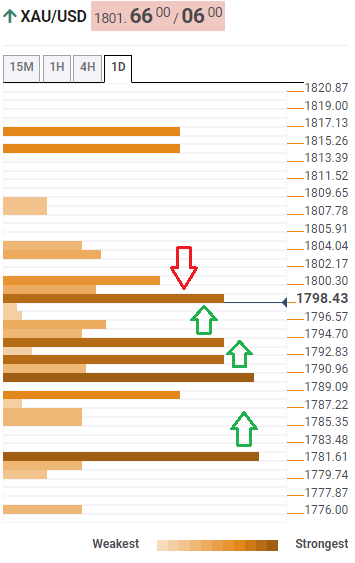
The Technical Confluences Detector shows that the gold price stays firmer above critical support around $1,790, which is the intersection of the SMA50 one-day, Fibonacci 61.8% one-day and previous low on four-hour. However, the bulls need to conquer the $1,800 resistance to retake the controls. The same includes upper Bollinger Band on one-hour, Fibonacci 23.6% one-month, as well as previous highs on 15-minute and one-hour.
Should buyers manage to conquer the $1,800 threshold, pivot point one-week S3 and previous high on four-hour will act as a validation point for the further upside around $1,802.
Following that, a smooth run-up towards Pivot point one-month R1 and previous month high, surrounding $1,816-17, can’t be ruled out.
On the contrary, $1,795 challenges the gold sellers on an immediate basis, the level comprises Fibonacci 23.6% one-day, SMA10 one-hour, Bollinger Band four-hour Middle and SMA100 one-day.
Also acting as short-term support is the $1,792 mark that holds together SMA50 one-hour, Fibonacci 38.2% one-day and SMA200 one-day.
Further, a clear break of $1,792 will need validation from the $1,790 support before fetching the quote towards $1,781 support including pivot point one-day S2.
Here is how it looks on the tool
About the Technical Confluences Detector
The TCD (Technical Confluences Detector) is a tool to locate and point out those price levels where there is a congestion of indicators, moving averages, Fibonacci levels, Pivot Points, etc. If you are a short-term trader, you will find entry points for counter-trend strategies and hunt a few points at a time. If you are a medium-to-long-term trader, this tool will allow you to know in advance the price levels where a medium-to-long-term trend may stop and rest, where to unwind positions, or where to increase your position size.
Author

Anil Panchal
FXStreet
Anil Panchal has nearly 15 years of experience in tracking financial markets. With a keen interest in macroeconomics, Anil aptly tracks global news/updates and stays well-informed about the global financial moves and their implications.