Gold Price Forecast: XAU/USD approaches $1,970 as USD Index’s pullback seems less confident, US CPI eyed


  • Gold price is marching towards the $1,970.00 resistance as the recovery move in the USD Index could conclude sooner.
  • Easing US labor market conditions have improved the odds of a neutral policy stance by the Fed.
  • Gold price is gathering strength for a breakout of the Symmetrical Triangle chart pattern.

Gold price (XAU/USD) has resumed its upside journey towards the $1,970.00 resistance in the European session. The precious metal is repossessing the spotlight as the recovery move in the US Dollar Index (DXY) seems less confident due to the absence of fundamental support.

S&P500 futures have surrendered half of the gains posted on Thursday as investors are shifting their focus toward the release of the United States Consumer Price Index (CPI) data. Market sentiment has turned cautious as the US inflation release could bring variation in expectations for the Federal Reserve (Fed) policy for June.

As per the preliminary report, headline inflation is seen softening to 4.2% vs. the prior release of 4.9%. Core CPI that strips off oil and food prices is expected to accelerate marginal to 5.6% vs. the former release of 5.5%. If core inflation continues to remain persistent, Fed chair Jerome Powell could be more favorable for the continuation of the policy-tightening spell.

Earlier, the street was divided about Fed’s policy stance but now easing labor market conditions have improved the odds of a neutral policy stance by the Fed. The USD Index has extended its recovery to near 103.60. Also, the yields offered on 10-year US Treasury bonds have climbed to 3.74%.

Gold technical analysis

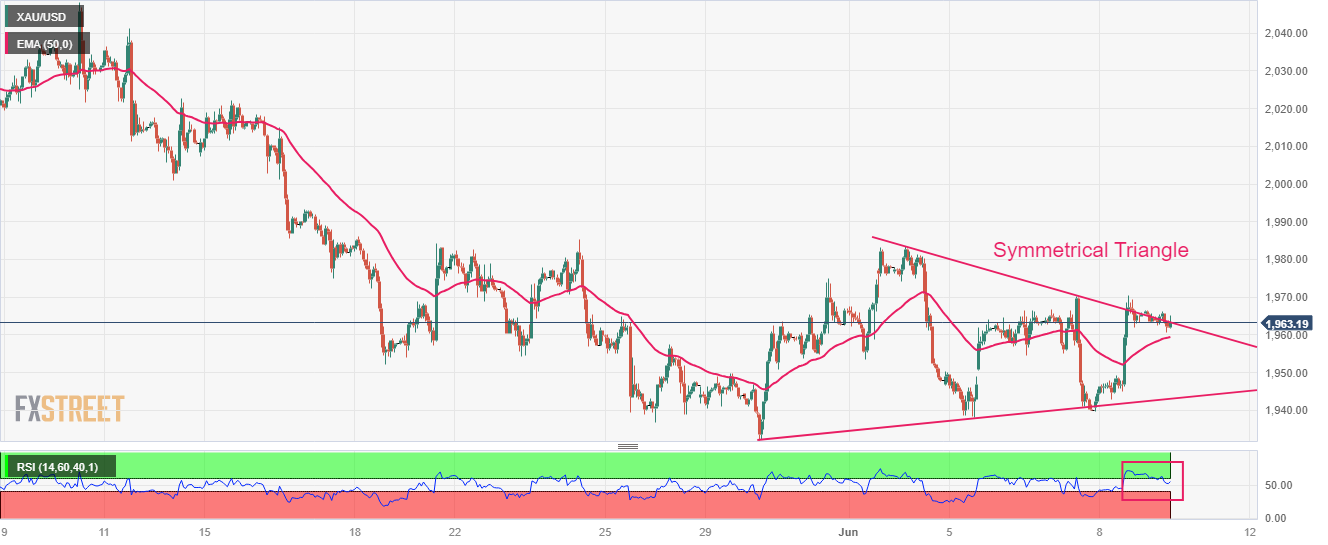
Gold price is gathering strength for a breakout of the Symmetrical Triangle chart pattern formed on an hourly scale. A breakout of the neutral triangle results in wider ticks and heavy volume. The precious metal is hovering near the downward-sloping trendline of the aforementioned pattern plotted from June 02 high at $1,983.50.

The yellow metal is trading above the 50-period Exponential Moving Average (EMA) at $1,959.70, which adds to the upside filters.

A confident break into the bullish range of 60.00-80.00 by the Relative Strength Index (RSI) (14) will trigger the upside momentum.

Gold hourly chart

XAU/USD

Overview
Today last price 1963
Today Daily Change -2.40
Today Daily Change % -0.12
Today daily open 1965.4
 
Trends
Daily SMA20 1967.42
Daily SMA50 1990.56
Daily SMA100 1940.93
Daily SMA200 1840.28
 
Levels
Previous Daily High 1970.55
Previous Daily Low 1939.72
Previous Weekly High 1983.5
Previous Weekly Low 1932.12
Previous Monthly High 2079.76
Previous Monthly Low 1932.12
Daily Fibonacci 38.2% 1958.77
Daily Fibonacci 61.8% 1951.5
Daily Pivot Point S1 1946.56
Daily Pivot Point S2 1927.73
Daily Pivot Point S3 1915.73
Daily Pivot Point R1 1977.39
Daily Pivot Point R2 1989.39
Daily Pivot Point R3 2008.22


Share: Feed news

Information on these pages contains forward-looking statements that involve risks and uncertainties. Markets and instruments profiled on this page are for informational purposes only and should not in any way come across as a recommendation to buy or sell in these assets. You should do your own thorough research before making any investment decisions. FXStreet does not in any way guarantee that this information is free from mistakes, errors, or material misstatements. It also does not guarantee that this information is of a timely nature. Investing in Open Markets involves a great deal of risk, including the loss of all or a portion of your investment, as well as emotional distress. All risks, losses and costs associated with investing, including total loss of principal, are your responsibility. The views and opinions expressed in this article are those of the authors and do not necessarily reflect the official policy or position of FXStreet nor its advertisers. The author will not be held responsible for information that is found at the end of links posted on this page.

If not otherwise explicitly mentioned in the body of the article, at the time of writing, the author has no position in any stock mentioned in this article and no business relationship with any company mentioned. The author has not received compensation for writing this article, other than from FXStreet.

FXStreet and the author do not provide personalized recommendations. The author makes no representations as to the accuracy, completeness, or suitability of this information. FXStreet and the author will not be liable for any errors, omissions or any losses, injuries or damages arising from this information and its display or use. Errors and omissions excepted.

The author and FXStreet are not registered investment advisors and nothing in this article is intended to be investment advice.

Recommended content


Recommended content

Editors’ Picks

EUR/USD turns negative near 1.0760

EUR/USD turns negative near 1.0760

The sudden bout of strength in the Greenback sponsored the resurgence of the selling pressure in the risk complex, dragging EUR/USD to the area of daily lows near 1.0760.

EUR/USD News

GBP/USD comes under pressure and challenges 1.2500

GBP/USD comes under pressure and challenges 1.2500

GBP/USD now rapidly loses momentum and gives away initial gains, returning to the 1.2500 region on the back of the strong comeback of the US Dollar.

GBP/USD News

Gold retreats from highs on stronger Dollar, yields

Gold retreats from highs on stronger Dollar, yields

XAU/USD trims part of its initial advance in response to the jump in the Dollar's buying interest and the re-emergence of the upside pressure in US yields.

Gold News

XRP tests support at $0.50 as Ripple joins alliance to work on blockchain recovery

XRP tests support at $0.50 as Ripple joins alliance to work on blockchain recovery

XRP trades around $0.5174 early on Friday, wiping out gains from earlier in the week, as Ripple announced it has joined an alliance to support digital asset recovery alongside Hedera and the Algorand Foundation. 

Read more

Week ahead – US inflation numbers to shake Fed rate cut bets

Week ahead – US inflation numbers to shake Fed rate cut bets

Fed rate-cut speculators rest hopes on US inflation data. After dovish BoE, pound traders turn to UK job numbers. Will a strong labor market convince the RBA to hike? More Chinese data on tap amid signs of slow Q2 start.

Read more

Forex MAJORS

Cryptocurrencies

Signatures