Gold Price Forecast: XAU/USD bulls committed ahead of key US events
- Gold bulls eye a run towards $1,800 from W-formation neckline support.
- All eyes will be on the Federal Reserve next week and key data before then.

Gold price is up on the day by some 0.22% after rising from a low of $1,781 to a high of $1,794.88 so far on Thursday. Markets have been relatively quiet on the day with little data released and the Federal Reserve in a blackout. Nevertheless, the US dollar eased, while investors positioned themselves ahead of key US inflation data and the Federal Reserve's policy meeting due next week.
The US Dollar index, as measured by the DXY index, fell 0.4% from a high of 105.433 to a low of 104.724, making gold less expensive for other currency holders. The dip came at the same time a rise in weekly jobless claims suggested that the labour market is slowing down. Weekly jobless claims rose to 230K, as expected. Continuing claims rose to 1.671M, topping the forecast of 1.6M and the data comes ahead of next week's Federal Reserve meeting.
There will be more key data events coming up before the Federal Reserve December 14 meeting. The Producer Price Index and the University of Michigan's consumer sentiment survey on Friday as well as November's Consumer Price Index are due. Investors will be on the watch for any signs that the Federal Reserve is getting ready to pause its hikes.
Fed expectations
Meanwhile, money markets show there is a 91% chance that the policy-setting Federal Open Market Committee (FOMC) will raise rates by half a point next week, and just a 9% chance there will be another 75 basis point increase with the rates peaking in May 2023 at 4.92%. The US Federal Reserve has already raised its policy rate by 375 basis points this year in the fastest hikes since the 1980s.
Meanwhile, supportive of the Gold price, safe haven assets were in strong demand amid growing recessionary fears this week as seen in the thirty-year Treasuries that dropped more than 10bp to a three-month low while yields on the 10-year were also lower. The yield curve between the 2-year and 10-year Treasury notes US 10-year has also widened in recent days.
Gold technical analysis
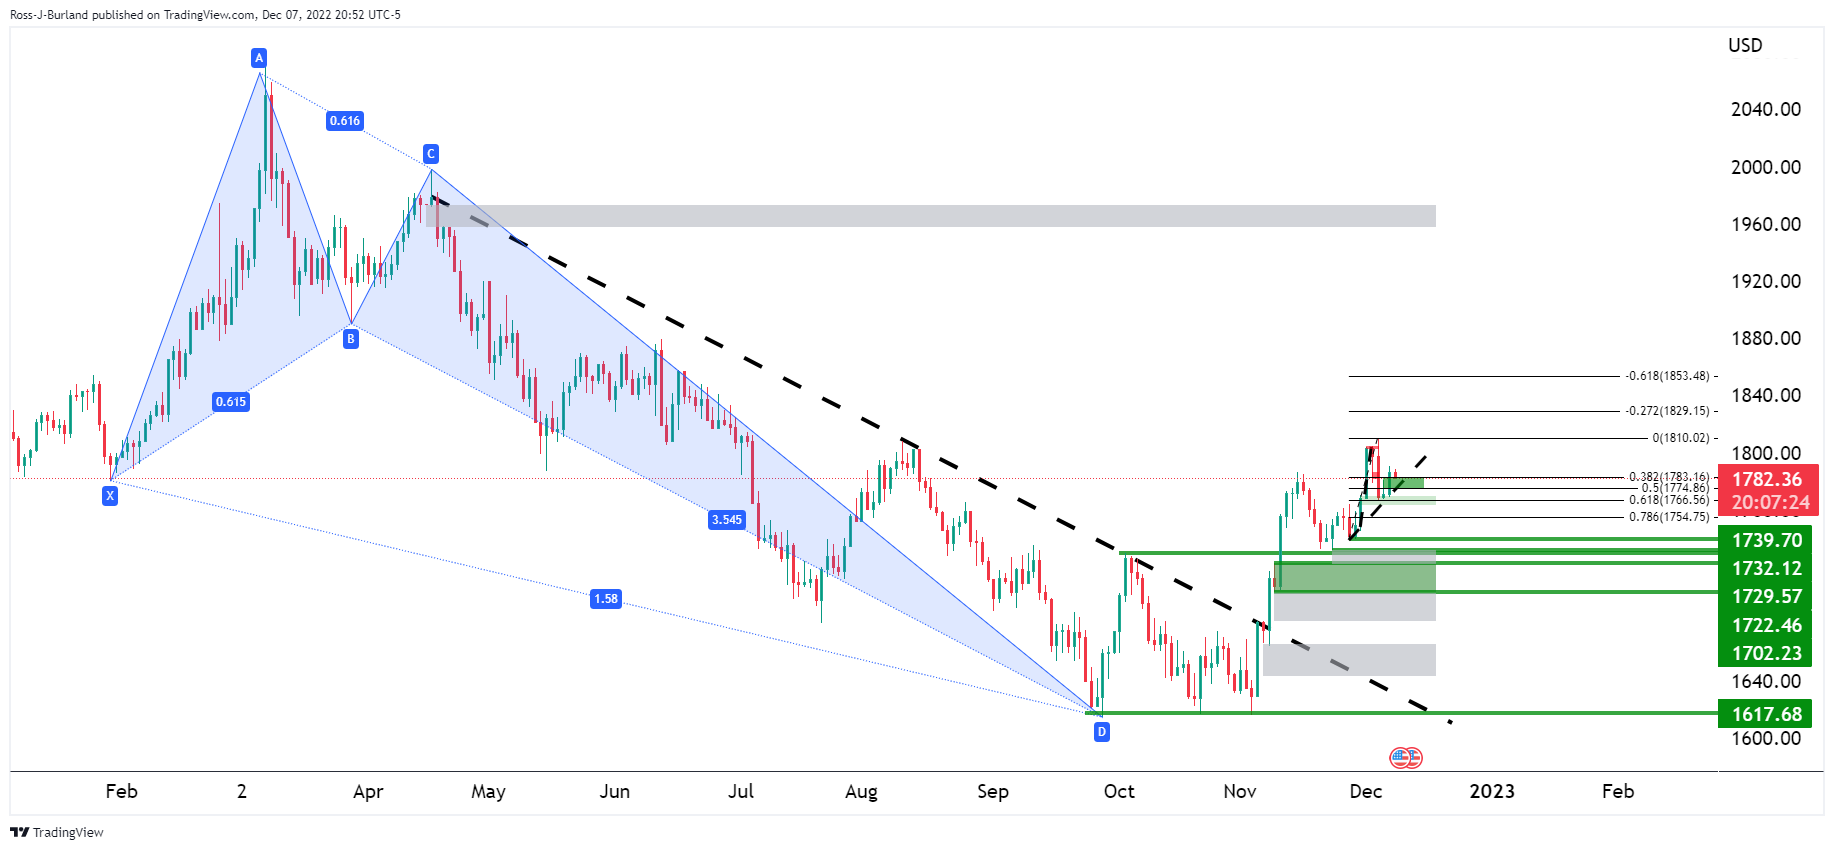
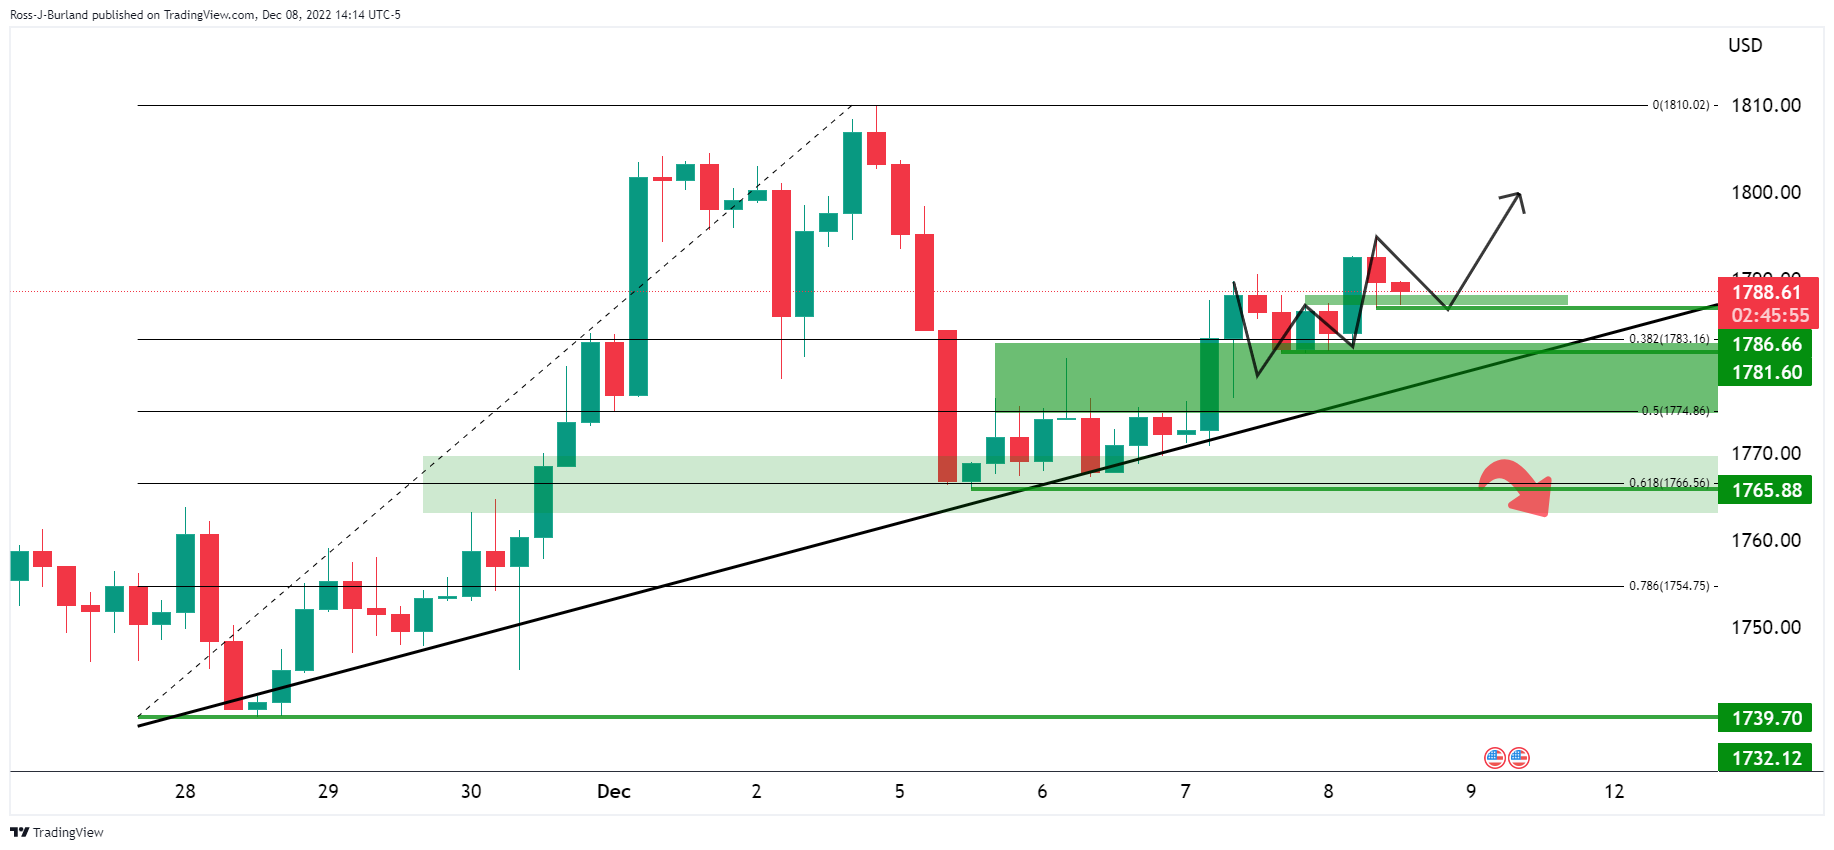
The daily charts above show the Gold price correcting in the harmonic formation although it has started to decelerate below the key $1,800s. On the 4-hour chart below, the Gold price is attempting to move higher and so long as the W-formation's neckline holds, there will be prospects of an upside continuation:
Author

Ross J Burland
FXStreet
Ross J Burland, born in England, UK, is a sportsman at heart. He played Rugby and Judo for his county, Kent and the South East of England Rugby team.


