Gold Price Forecast: Fed inflation clues, $1,975 hurdle prod XAU/USD rebound – Confluence Detector
- Gold Price pares the biggest daily loss in two months at the lowest level in a fortnight.
- US Dollar grinds near 13-day top as markets await more clues to extend previous data-backed rally.
- Fed’s readiness for September rate hike amplifies importance of US Core PCE Price Index, NFP.
- Risk catalysts, yields should also be eyed closely as XAU/USD stays beneath $1,975 resistance confluence.

Gold Price (XAU/USD) prints mild gains as it consolidates the biggest daily loss since June 02 while staying on the way to posting the first weekly loss in four. In doing so, the bright metal justifies the market’s cautious optimism amid mixed concerns about the Federal Reserve’s (Fed) next step and the US-China tension ahead of the last shot of the top-tier US data.
Market sentiment dwindles as the stock futures print mild gains and the yields edge higher amid the battle between the strong US growth data and the central bank’s inability to convince policy hawks. Adding to this, Washington’s latest measures renew fears of the fresh US-China tussles and prod the XAU/USD recovery, along with expectations of a September rate hike from the Federal Reserve (Fed).
That said, the Fed’s favorite inflation gauge, namely the Core Personal Consumption Expenditure (PCE) Price Index for June, expected 4.2% YoY versus 4.6% prior, will be crucial to watch for clear directions ahead of the next week’s employment data.
Also read: Gold Price Forecast: XAU/USD needs validation from 100 DMA on the road to recovery
Gold Price: Key levels to watch
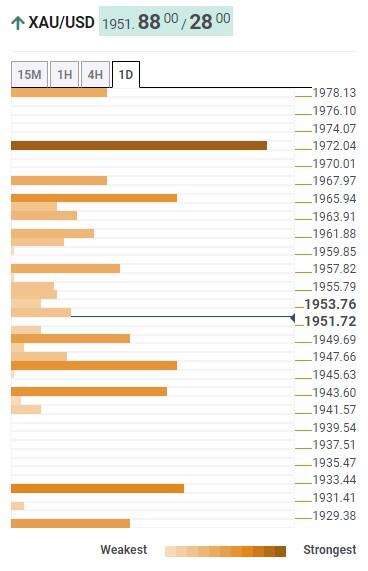
As per our Technical Confluence indicator, the Gold Price stays beneath the short-term key resistance despite the latest corrective bounce at the lowest level in 13 days.
That said, Fibonacci 38.2% on one-day restricts the immediate upside of the XAU/USD around $1,958 while the 100-DMA prods the Gold buyers around $1,965 resistance.
However, major attention is given to the convergence of the Fibonacci 38.2% on one-week and the Pivot Point one-day, as well as one-month, R1 surrounding $1,975.
Following that, the Gold Price can hit the $2,000 psychological magnet.
Alternatively, the 50-DMA joins the middle band of the Bollinger on the daily chart and the previous weekly low to highlight $1,946 as an immediate support for the XAU/USD sellers to watch during the quote’s fresh fall.
Also restricting the nearby decline of the Gold Price is the joint of Pivot Point one-week S1, previous daily low and lower band of the Bollinger on the four-hour chart, close to $1,944 at the latest.
In a case where the Gold Price drops below $1,944, the bears can quickly touch the Pivot Point one-day S1 surrounding $1,932 before jostling with the Fibonacci 38.2% on one-month, close to $1,930.
Overall, the Gold Price remains on the bear’s radar unless breaking $1,975 ressistance.
Here is how it looks on the tool
About Technical Confluences Detector
The TCD (Technical Confluences Detector) is a tool to locate and point out those price levels where there is a congestion of indicators, moving averages, Fibonacci levels, Pivot Points, etc. If you are a short-term trader, you will find entry points for counter-trend strategies and hunt a few points at a time. If you are a medium-to-long-term trader, this tool will allow you to know in advance the price levels where a medium-to-long-term trend may stop and rest, where to unwind positions, or where to increase your position size.
Author

Anil Panchal
FXStreet
Anil Panchal has nearly 15 years of experience in tracking financial markets. With a keen interest in macroeconomics, Anil aptly tracks global news/updates and stays well-informed about the global financial moves and their implications.


