Gold Price Forecast: XAU/USD remains depressed below $1,760 amid higher US T-yields
- Gold is starting out the week on the backfoot.
- Gold bulls are under pressure near-daily support.
- Inflation concerns are keeping the US dollar underpinned on Fed expectations.

Update: Gold prices continue to face pressure near the higher levels and trades in a broader range of $1,750 and $1,770 for the past week. Multiple factors contributed to the downside movement in the precious metal, which included a steady US dollar, higher US T-bond yields and weekly equities gains. The US Dollar Index (DXY), which tracks the buck’s performance against its six major rivals, stays strong near 94.10 with mild losses. A higher USD valuation makes gold expensive for the other currencies holder. The US benchmark 10-year Treasury yields jumped to 1.61% as investors remain concerned over persistently higher inflation and expectations of early Fed tapering as soon as November, despite disappointing NFP data. However, the recent pullback in equities points at risk aversion among investors, which provided support to the precious metal at lower levels. It is worth noting that, S&P Futures is trading at 4,367.50 down 0.33% for the day.
The price of gold on Monday in Asia has started out on the backfoot as the greenback pops into bullish territory as measured by the DXY, or against a basket of rival major currencies. At the time of writing, XAU/USD is trading at $1,751.29 and down some 0.3%, falling from a high of $1,758.40.
The Labor Department said in its employment report on Friday that nonfarm payrolls increased by 194,000 jobs last month. Economists polled by Reuters had forecast payrolls increasing by 500,000 jobs. The US dollar was largely unmoved by a disappointing US Employment report on Friday. Investors were of the opinion that the lacklustre numbers may not sway the Federal reserve from starting a tapering of its asset purchases as early as November.
The data implies that the winter period could be slower in terms of growth, but inflation pressures are still expected to persist. This means that despite a potential slowdown, the Federal Reserve will still be looking to start the process of reducing its monthly bond purchases as soon as the November 2-3 policy meeting.
''The jobs report came in well below expectations, questioning the timing of a well-telegraphed November taper, as well easing some enthusiasm about Fed hikes in 2022,'' analysts at TD Securities explained.
Stagflation risks is a + for gold
''While the taper is a foregone conclusion, there could be some short-covering following aggressive flows associated with the pricing of a November Fed exit. Looking beyond Fed pricing, higher wages and no rise in participation rate will keep the stagflation theme alive, and gold could be an ideal hedge against these rising stagflationary winds,'' the analysts at TDS argued.
From another angle, the analysts also take in the global energy crisis which has been intensifying. The analysts at TDS explained that this is ''impacting the production of goods across the world and supply chains across Europe and Asia, so reasons to own the yellow metal are growing more compelling.''
''Indeed, as these issues fuel concerns of slowing demand and rising inflation, price action across rates in recent trading sessions suggest that global macro is just starting to price in implications of the energy crisis. After all, the Post-Fed move higher in rates was led by real rates, whereas it is now being led by breakevens, suggesting the market is pricing in higher inflation due to the spike in energy, but acknowledging that this is a supply-shock which impacts growth negatively.''
''In turn, with positioning in the yellow metal increasingly short, including CTAs, potential strength in gold due to this growing stagflationary narrative could spark aggressive short covering on the horizon.''
Gold technical analysis
The price of gold is poised for an upside move from daily support as illustrated in the following article and chart below:
Gold, Chart of the Week: XAU/USD bulls are stepping in
Gold, daily chart
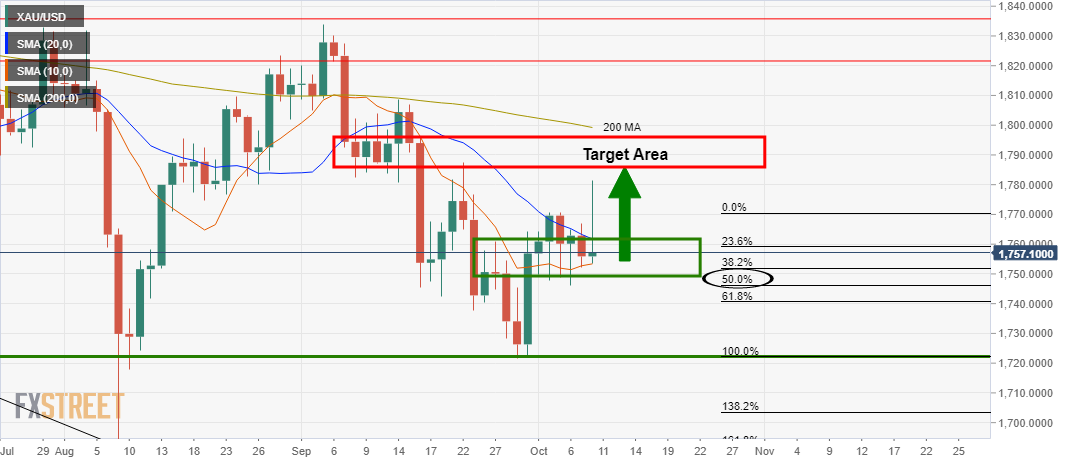
''Given the daily bullish close at support and the wick, the expectations are for it to be filled in by price action in the next few sessions. The target area for gold is based on a -272% Fibonacci retracement of the 50% mean reversion and corrective range. This comes in at 1,790 with a confluence of the prior structure and en route to gold's 200-day moving average. ''
Author

Ross J Burland
FXStreet
Ross J Burland, born in England, UK, is a sportsman at heart. He played Rugby and Judo for his county, Kent and the South East of England Rugby team.


