|

Gold Chart of the Week: XAU/USD bulls step in

  • Gold bulls are forming a phalanx at critical support. 
  • The $1,770s are eyed for a daily target for the coming sessions. 

The price of gold has been making the case for an upside recovery since rallying on the last day of September. In the prior week, the price corrected to key daily support, and this leaves the prospects for an upside extension favourable for the week ahead. 

The following is a top-down analysis that illustrates such a bias for the meantime:

Gold monthly chart 
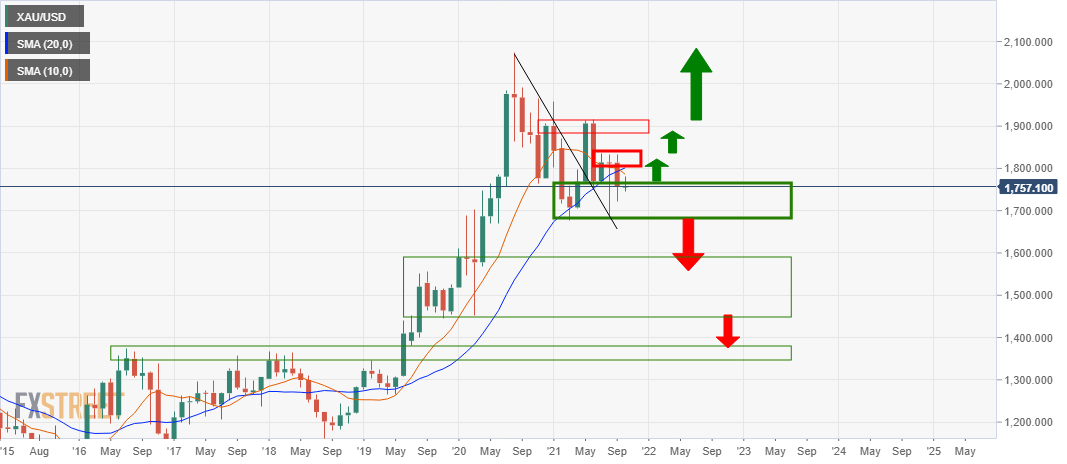
The monthly gold chart shows that the price is vulnerable to the downside, although it is holding in the bullish territory outside the counter trend line by the skin of its teeth. That being said, the 10/20 moving average crossover to the downside is bearish, and a break of support risks territory to test $1,600 and $1,500. For the longer term in gold, bulls need to get above $1,900. 

Gold weekly chart 
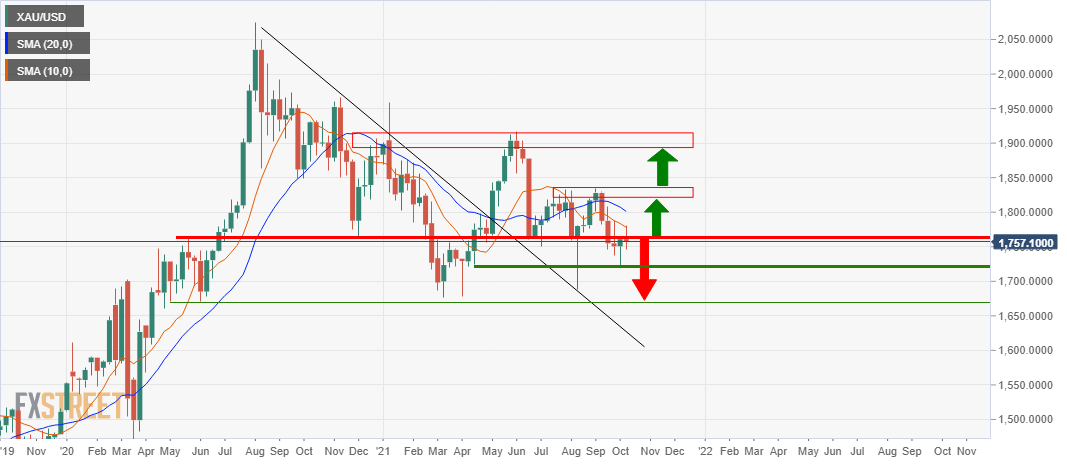
There is a lack of direction from a weekly perspective for gold. The price needs to get above $1,760 and then $1,830 to target $1,900. If the gold price fails to get above $1,760 and hold with a bullish close in the forthcoming week, then the downside prospects will be more compelling toward $1,672. 

Gold daily chart
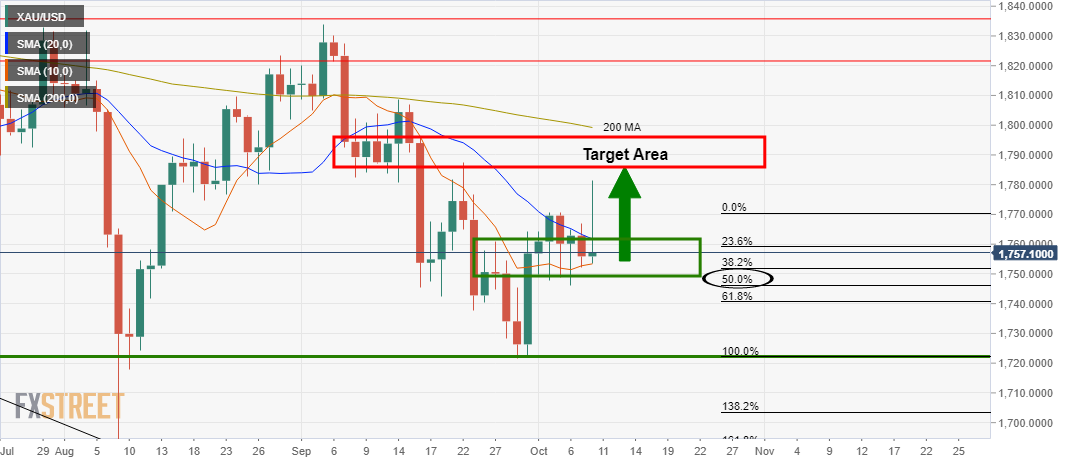
However, given the daily bullish close at support and the wick, the expectations are for it to be filled in by price action in the next few sessions. The target area for gold is based on a -272% Fibonacci retracement of the 50% mean reversion and corrective range. This comes in at $1,790 with a confluence of the prior structure en route to gold's 200-day moving average. 

Gold 4-hour chart 
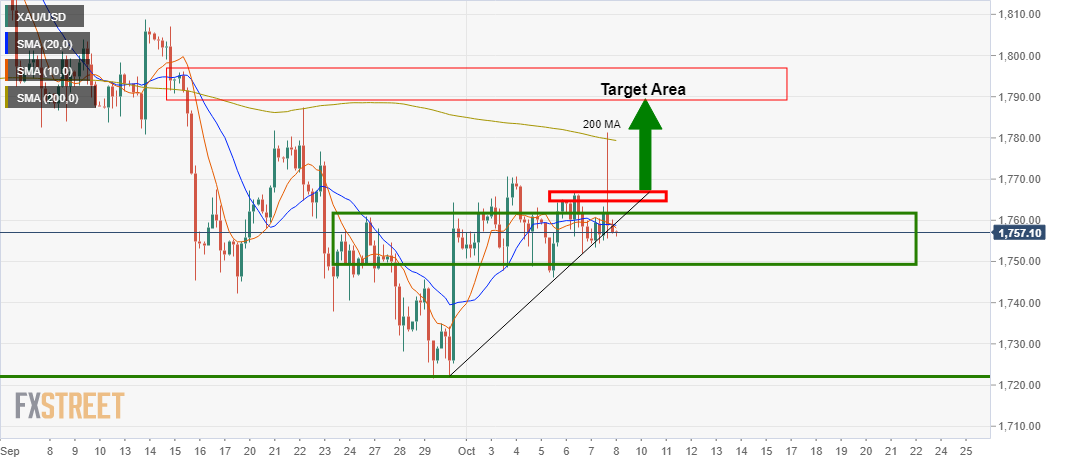
From a 4-hour perspective, gold bulls would be prudent to see the price make a move in the direction of the target to break the near term resistance around $1,770. In engaging above this area, there is a higher probability of a bullish continuation for gold this week. 

Author

Ross J Burland

Ross J Burland, born in England, UK, is a sportsman at heart. He played Rugby and Judo for his county, Kent and the South East of England Rugby team.


More from Ross J Burland
Share:

Editor's Picks

AUD/USD consolidates above 0.6950 amid risk aversion

AUD/USD consolidates in the Asian session on Thursday, trading just above 0.6950 as traders assess developments in the Middle East crisis. The Pentagon reportedly ordered readiness for potential strikes against Iran. This keeps the geopolitical risk premium in play, which, along with hawkish FOMC Minutes and elevated US bond yields, will likely keep the US Dollar underpinned at the expense of the pair.

USD/JPY slips below 158.00 as USD retreats

USD/JPY returns to the red below 158.00 in the Asian session on Thursday amid speculation that authorities will step in to prop up the Japanese Yen. Meanwhile, the US Dollar eases from near an 18-month high on profit taking, ignoring Wednesday's hawkish FOMC Minutes and the risk of a further escalation of tensions in the Middle East, adding to the pair's pullback.

Gold struggles as rising yields and hawkish Fed signals weigh

Gold reverses its modest recovery on Thursday as a stronger US Dollar and rising US Treasury yields cap upside attempts, leaving the metal in a bearish consolidation phase near two-month lows. At the time of writing, XAU/USD trades around $4,119, easing from an intraday high of $4,143.

Ripple and Stellar test key support amid rising downside risks
Ripple (XRP) and Stellar (XLM) remain under pressure and extend their corrections on Thursday as weakening derivatives metrics and broader macroeconomic headwinds weigh on sentiment. XRP and XLM approach a key support zone after three consecutive days of losses so far this week.
The UK 30-year gilt just hit a 1998 high. Is that good or bad for the British Pound?
The yield on the UK's 30-year government bond, or gilt, went through 6% on October 1 for the first time since early 1998, and on Monday the Pound was at its strongest against the Euro since June 2025. The gilt market's 28-year high is mostly someone else's. Since early May, the 30-year gilt yield has risen about 0.15 of a percentage point and the US 30-year about 0.7.
The UK 30-year gilt just hit a 1998 high. Is that good or bad for the British Pound?
The yield on the UK's 30-year government bond, or gilt, went through 6% on October 1 for the first time since early 1998, and on Monday the Pound was at its strongest against the Euro since June 2025. The gilt market's 28-year high is mostly someone else's. Since early May, the 30-year gilt yield has risen about 0.15 of a percentage point and the US 30-year about 0.7.














