Gold Price Forecast: Steady around $1,760, as US T-bond yields cling to 1.60%
- Gold is consolidating above critical dynamic daily support.
- Markets are weighing the prospects of stagflation in surging energy costs.
- Gold is renowned as the perfect hedge for stagflation risks.

GOLD UPDATE
As the Asian session kicks in, Gold (XAU/USD) is losing 0.09%, trading at $1,763.42 at the time of writing. Meanwhile, the greenback, which finished in the green in the New York session, reversed its previous path, slides 0.03%, is trading at 93.957. The US 10-year Treasury yield rose one basis point, up to 1.591%, a tenth short of the 1.60% threshold.
US T-bond yields rose during the New York session. The gap between the five and the 30-year Treasury yield contracted amid increasing expectations that the Federal Reserve may lift policy rates as soon as the following year. It seems that the abovementioned could lie on the back of the Bank of England Governor Andrew Bailey, which spoke at a G30 meeting. Bailey said that while central banks don’t have the tools to fix the supply disruptions and bottlenecks, he believes that although inflation is temporary, policymakers will need to prevent higher inflation pressures from becoming permanent.
From a technical perspective, gold (XAU/USD) is approaching Monday’s low at $1,760.15. The Relative Strength Index at 47, is flattish indicating that consolidation around the current levels lies ahead. Nevertheless, the outcome of a break lower due to US dollar strength could open the door towards a downward move to the October 6 low at $1,745.72.
On the flip side, an upward move above Monday’s high at $1,771.95 could open the way for a leg-up towards the 50-day moving average (DMA) at $1,777.59, immediately followed by the confluence of a downward slope resistance trendline and the 200-DMA at $1,794.50
END OF UPDATE
The price of gold is currently trading at $1,765.25 into the Wall Street close and is down some 0.12% after falling from a high of $1,772.10 to a low of $1,760.37. While the US dollar fell out of the wrong side of the bed in New York morning, it has moved slightly higher overnight. Treasury yields rose on expectations the Federal Reserve will need to hike interest rates sooner than previously expected to quell rising price pressures.
Trades are looking ahead to next month's Fed meeting where they expect the US central bank to act as inflation looks to be stubbornly persistent and unlikely to fade anytime soon. However, the Fed is not the only central bank on course to start raising rates which potentially strips the greenback of some of the demand that it has enjoyed more recently in 2021. For instance, New Zealand faced its highest inflation pressures in a decade in data revealed on Tuesday and the Bank of England Governor Andrew Bailey has also been wires with hawkish rhetoric.
Gold is the stagflation hedge
The price of oil on Tuesday gave back some gains following a move into seven-year highs, as seen in the following chart of WTI:
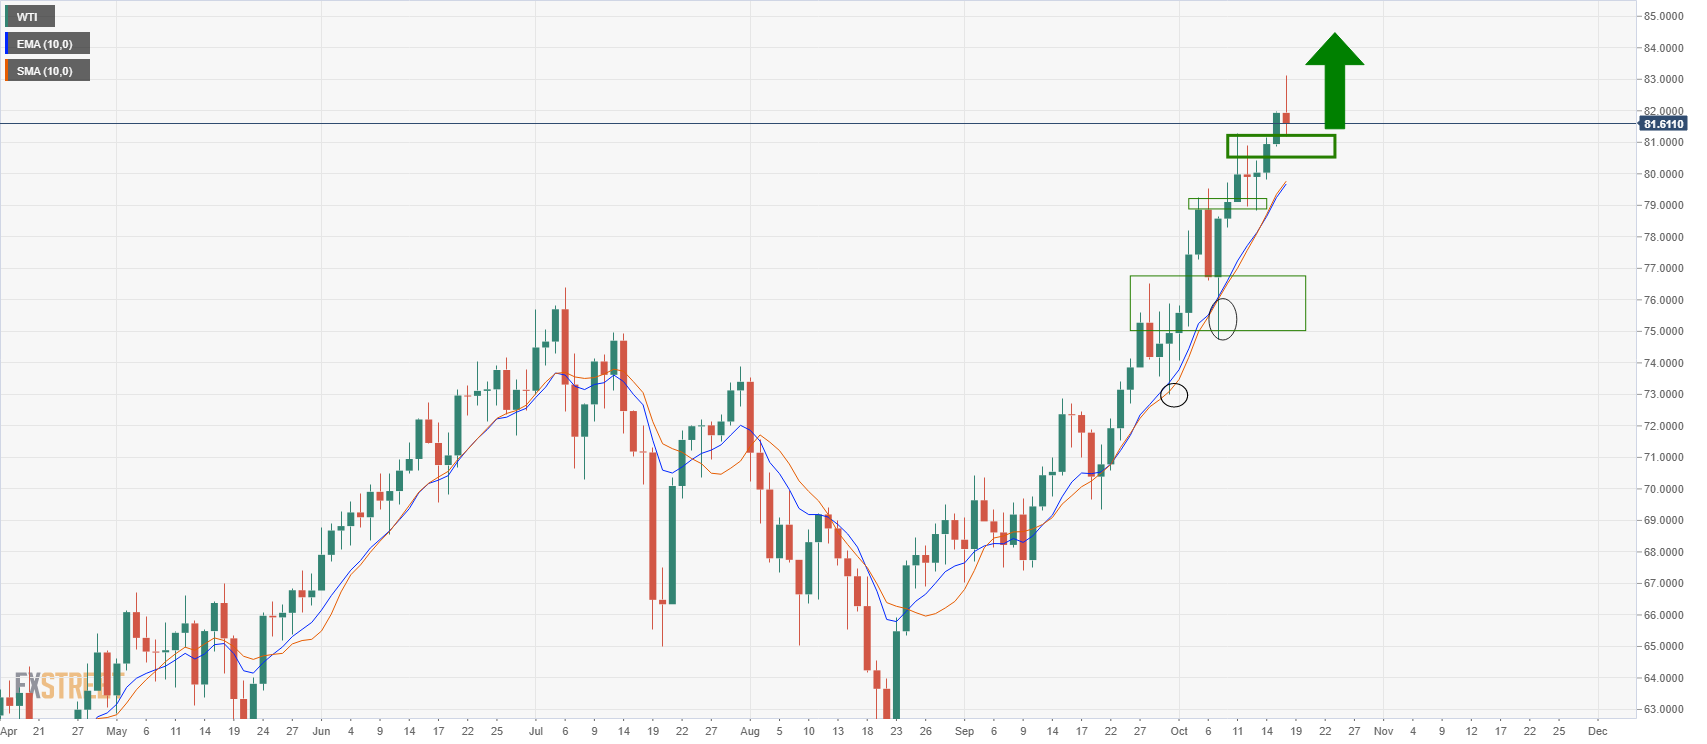
However, the correction to the daily support might entice more demand from strong bullish hands in the energy complex, which leads to the risk of stagflation.
''The prospect of a prolonged period of higher inflation is spooking global central banks, and the fears of central bank tightening is weighing on precious metals,'' analysts at TD Securities explained. ''But market pricing for Fed hikes fails to consider that inflation due to a potential energy shock would be unlikely to elicit a Fed response, considering that it is growth-negative,'' the analysts added.
''In turn, market pricing for Fed hikes is too hawkish relative to TD Securities' expectations, notwithstanding the potential for the global energy crisis to intensify. This suggests gold is an ideal hedge against rising stagflationary winds, and reasons to own the yellow metal are growing more compelling.''
The analysts warned further that ''a cold winter could send energy prices astronomically higher, potentially pricing-out industries and fueling price asymmetries in markets — which translates into a fat right tail for gold prices...In the near-term, gold's failure to hold onto positive momentum has prompted yet another whipsaw for CTA trend followers, with marginal selling underway.''
Gold technical analysis
For the latest in-depth technical analysis of gold, see here: Gold Chart of the Week: XAU hit the $1,800 target, now what?
However, at a snapshot, we are likely to see some consolidation to continue to play out:
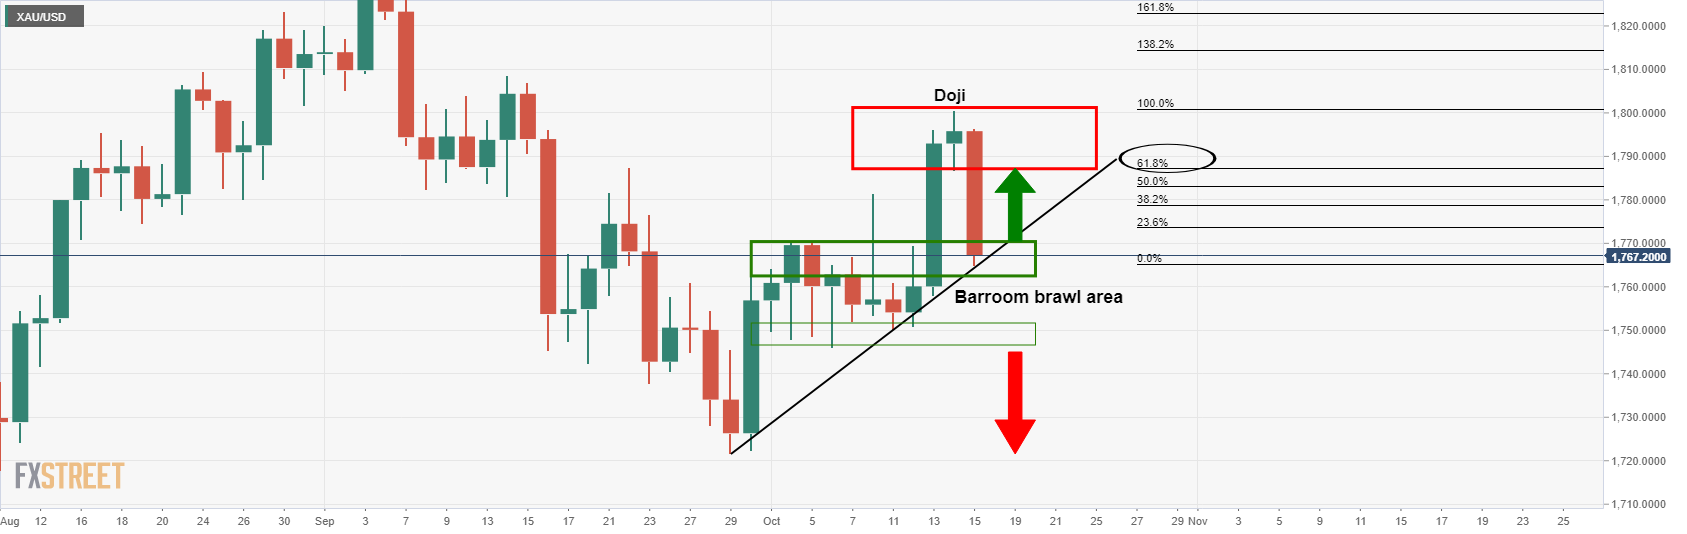
''As illustrated above, the price is testing not only dynamic support but horizontal also. This would be expected to hold initial tests and potentially lead to a restest of the prior day's lows of the Doji candle which has a confluence with the 61.8% Fibonacci retracement level near 1,786.''
''If gold does manage to break the dynamic trendline support, there is still going to be room into the 1,750s where price could find itself stuck in a range, aka, the ''barroom brawl''.
If, on the other hand, the price holds and moves up beyond 1,770 again, that would be bullish.''
Author

Ross J Burland
FXStreet
Ross J Burland, born in England, UK, is a sportsman at heart. He played Rugby and Judo for his county, Kent and the South East of England Rugby team.


