Gold Chart of the Week: XAU hit the $1,800 target, now what?
- Gold bulls eye the Sep highs near $1,830 for the weeks ahead.
- $1,770 is a key level that bulls need to overcome this week.
- Stagflation risks should underpin the precious metal.

As per the prior week's Gold Chart of the Week: XAU/USD bulls step in, $1,770, $1,790 and then the 200-day MA was eyed as targets for last week, all of which were achieved into $1,800.
Gold daily chart, prior analysis
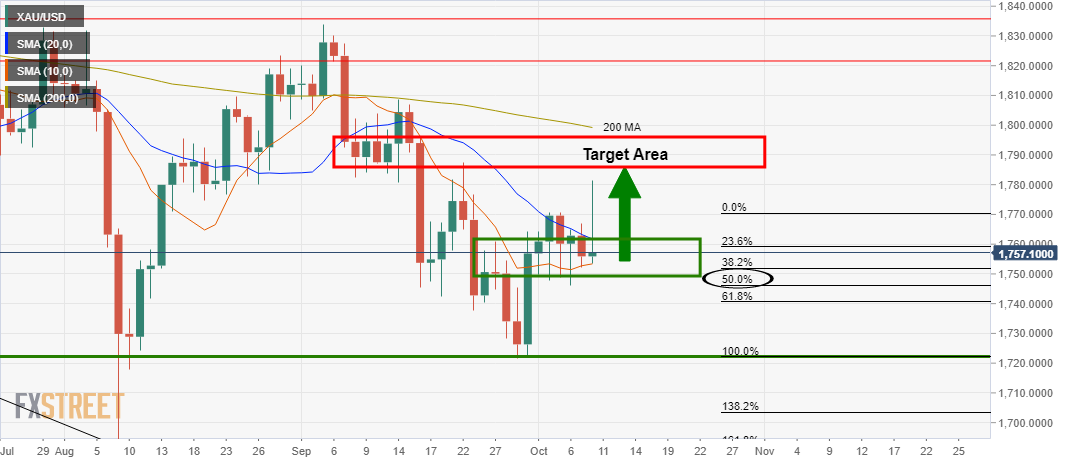
The upside projection was based on a longer-term analysis, but also the given the daily bullish close at support and the wick: It was stated that ''the expectations are for it to be filled in by price action in the next few sessions. The target area for gold is based on a -272% Fibonacci retracement of the 50% mean reversion and corrective range. This comes in at $1,790 with a confluence of the prior structure en route to gold's 200-day moving average.''
Gold's prior 4-hour analysis
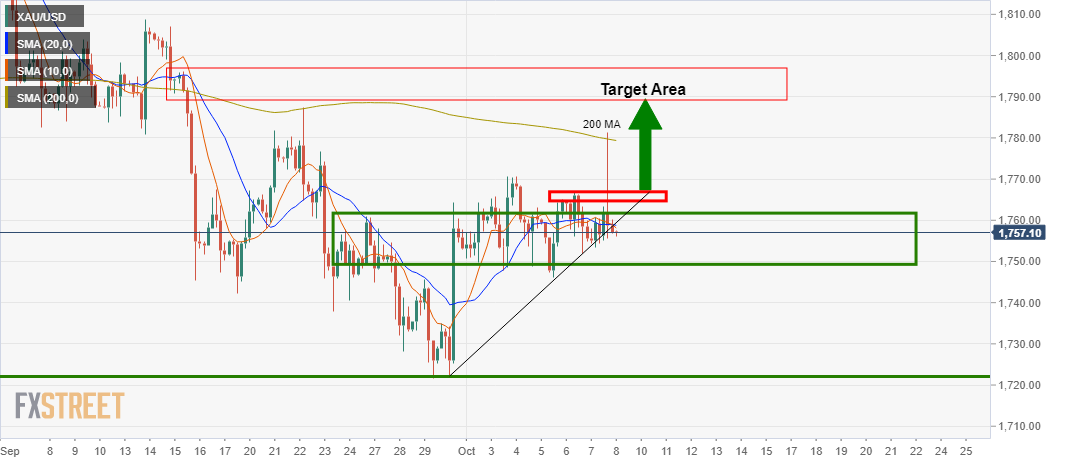
From a 4-hour perspective, gold bulls would be prudent to see the price make a move in the direction of the target to break the near term resistance around $1,770. In engaging above this area, there is a higher probability of a bullish continuation for gold this week.
Gold, live market update
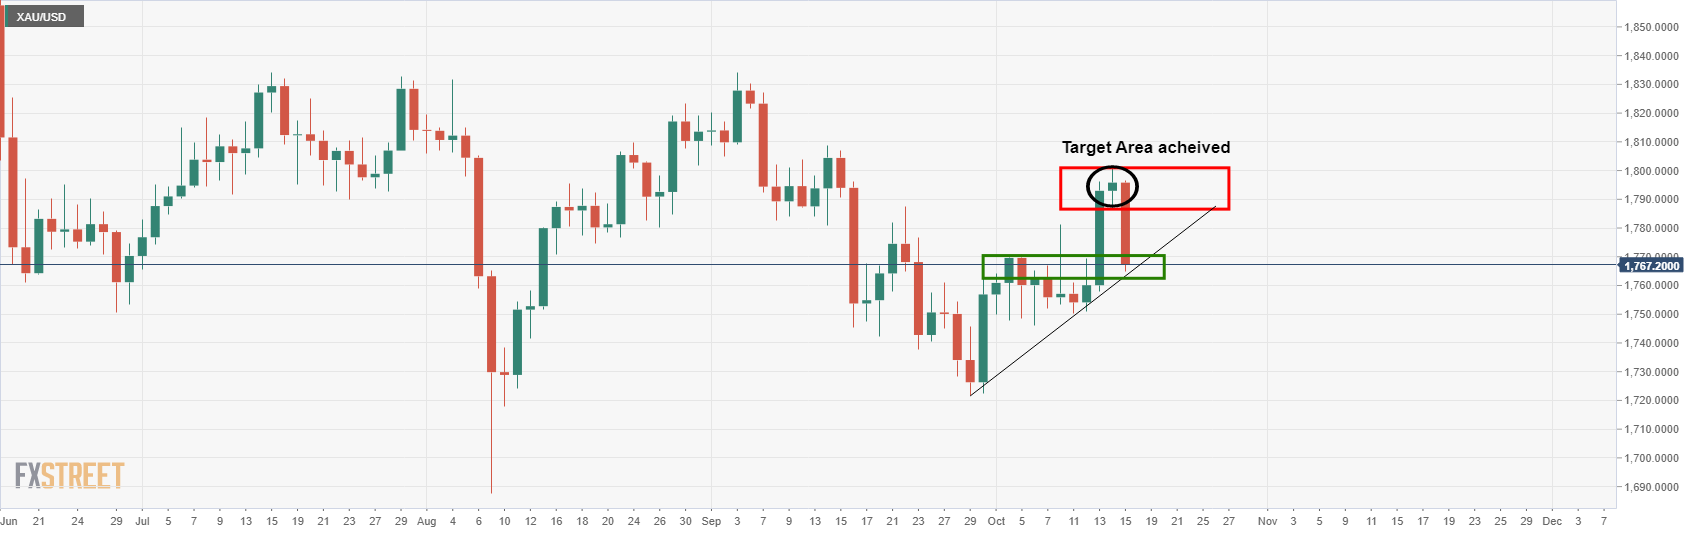
The price has met the target area but was rejected heavily on the last day of trade last week. The move was blamed on a spike in US yields, Retail Sales surprising to the upside and risk-on appetite. The data likely sent the algos into sell mode as the data pointed to a stronger economy and higher expectations of the Federal Reserve to hike rates sooner than what was priced in.
However, the real focus has to be on inflation and as well as the energy crisis. Stagflation is a real risk that is bound to start to gain some traction for the week ahead as traders survey a number of macro risks, including China's economy and supply shocks.
''Gold is an ideal hedge against rising stagflationary winds, but market pricing for Fed hikes fails to consider that a potential energy supply shock would be unlikely to elicit a Fed response,'' analysts at TD Securities explained. ''In turn, market pricing for Fed hikes is too hawkish relative to TD Securities' expectations.''
Putting fundamentals aside, technically, the drop On Friday will have sent weaker bulls to the sidelines and we are likely to see some consolidation to start the week off.
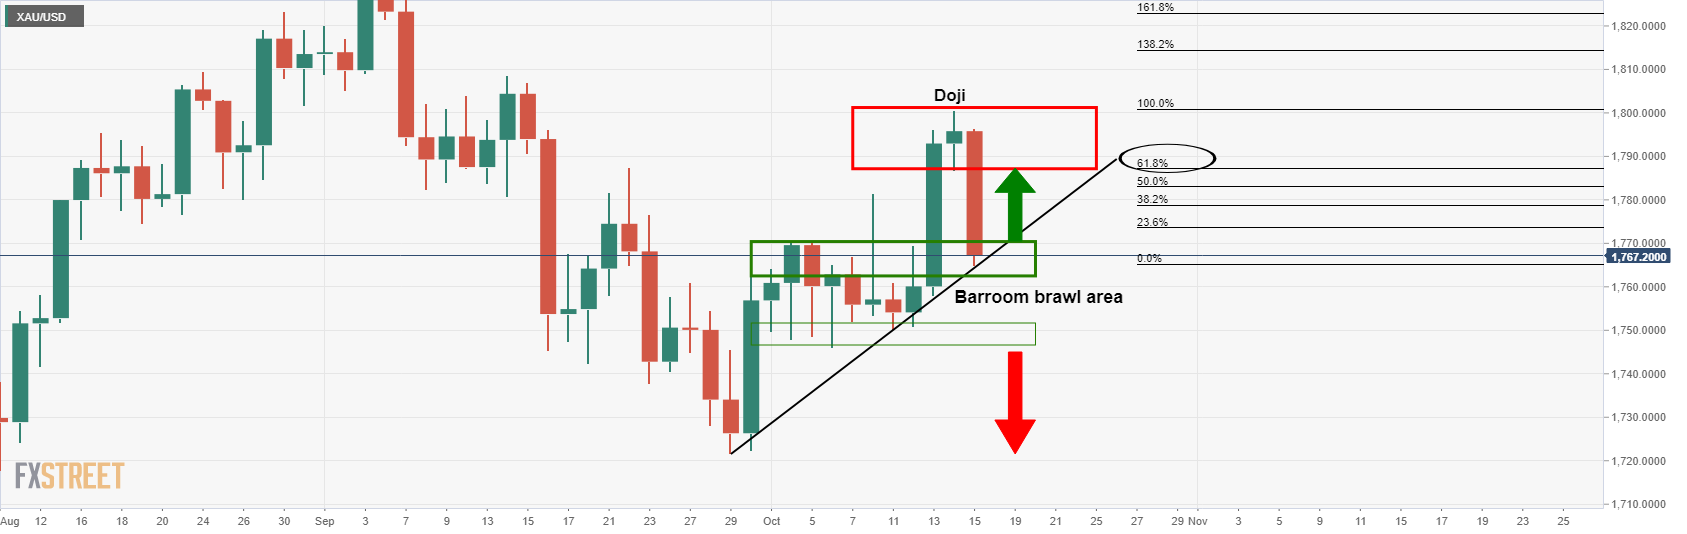
As illustrated above, the price is testing not only dynamic support but horizontal also. This would be expected to hold initial tests and potentially lead to a restest of the prior day's lows of the Doji candle which has a confluence with the 61.8% Fibonacci retracement level near 1,786.
If gold does manage to break the dynamic trendline support, there is still going to be room into the 1,750s where price could find itself stuck in a range, aka, the ''barroom brawl''.
If, on the other hand, the price holds and moves up beyond 1,770 again, that would be bullish as follows on the weekly chart:
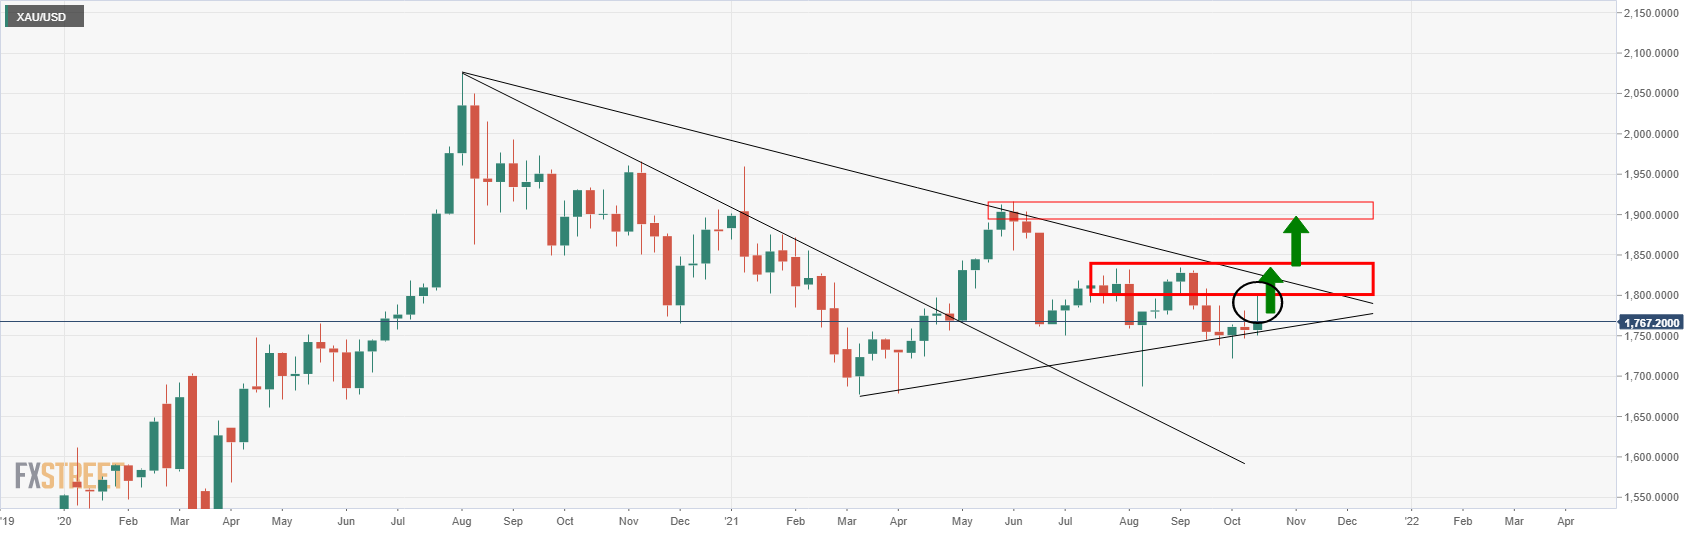
The wick on the weekly chart and bullish close are compelling. The wick would be expected to be filled over the course of the next week from a lower time frame perspective and this leaves the prior tops between July - Sep exposed near 1,835.
Premium
You have reached your limit of 3 free articles for this month.
Start your subscription and get access to all our original articles.
Author

Ross J Burland
FXStreet
Ross J Burland, born in England, UK, is a sportsman at heart. He played Rugby and Judo for his county, Kent and the South East of England Rugby team.


