Gold Price Forecast: $1,927 could challenge XAUUSD’s road to recovery – Confluence Detector
- Gold Price extends the rebound amid a sharp correction in the US dollar.
- Profit-taking engulfs the dollar heading into the Fed and NFP next week.
- $1,890 appears as strong support for XAUUSD while $1,927 guards the upside.

Month-end flows combined with profit-taking have triggered a sharp correction in the US dollar against its major rivals, aiding Gold Price to recover sizeable ground above the $1,900 mark. Investors unwind their USD longs ahead of next Wednesday's critical Fed rate hike decision, with a 50-bps lift-off well priced in. The rebound in Gold Price, however, appears shallow, as the dollar will continue capitalizing on the aggressive Fed rate hike expectations, despite the dismal US Q1 GDP print.
Also read: Gold Price Forecast: XAUUSD rebound - a good selling opportunity?
Gold Price: Key levels to watch
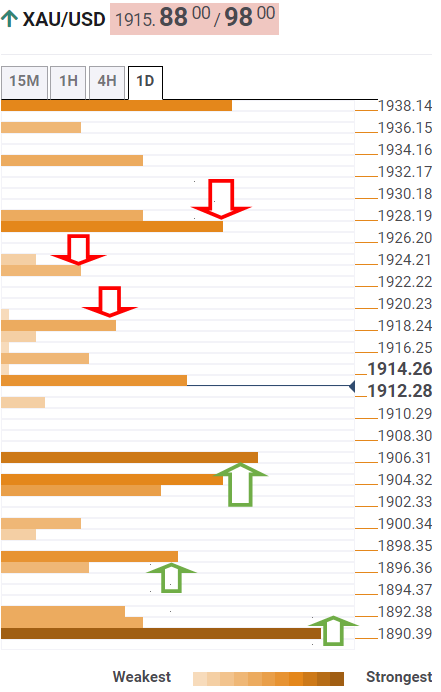
The Technical Confluences Detector shows that Gold Price is running into stiff resistance near $1,918 on the road to recovery.
A sustained break above the latter will put the SMA50 four-hour at $1,923 to test, above which the confluence of the previous week’s low and pivot point one-day R3 at $1,927 will challenge the additional upside.
Alternatively, if the recovery momentum fizzles out, then sellers could target the pivot point one-day R2 at $1,913 once again.
The next relevant support awaits around $1,905, where a dense cluster of support levels comprising the pivot point one-week S1, SMA5 one-day and pivot point one-day R1 converge.
The previous day’s high at $1,898 will be tested on the move lower. The last line of defense for XAU bulls is seen at $1,890, the intersection of the Fibonacci 23.6% one-day, the previous month’s low and SMA10 four-hour.
Here is how it looks on the tool
About Technical Confluences Detector
The TCD (Technical Confluences Detector) is a tool to locate and point out those price levels where there is a congestion of indicators, moving averages, Fibonacci levels, Pivot Points, etc. If you are a short-term trader, you will find entry points for counter-trend strategies and hunt a few points at a time. If you are a medium-to-long-term trader, this tool will allow you to know in advance the price levels where a medium-to-long-term trend may stop and rest, where to unwind positions, or where to increase your position size.
Author

Dhwani Mehta
FXStreet
Residing in Mumbai (India), Dhwani is a Senior Analyst and Manager of the Asian session at FXStreet. She has over 10 years of experience in analyzing and covering the global financial markets, with specialization in Forex and commodities markets.