- Gold price renews four-day high, approaches six-month-old resistance.
- US Dollar weakness joins China-linked optimism to favor XAU/USD bulls.
- Convergence of previous monthly high, golden ratio restricts downside ahead of US CPI, FOMC.
Gold price (XAU/USD) stays on the front foot for the fourth consecutive day as it cheers the broad-based US Dollar weakness to poke $1,800. Further, optimism surrounding China adds strength to the bullion’s run-up as traders await early signals for US inflation. It’s worth noting, however, that the cautious optimism ahead of next week’s Federal Open Market Committee (FOMC) meeting and the US Consumer Price Index (CPI) for November appears to challenge the Gold price. Considering the early signals, the Fed is likely to defend the policy hawks, despite suggesting a 0.50% rate hike, which in turn could keep the XAU/USD on the dicey floor and may allow the Gold buyers to retreat in case of US Dollar positive outcomes.
Also read: Since the Gold rally has stopped, can a reversal be expected?
Gold Price: Key levels to watch
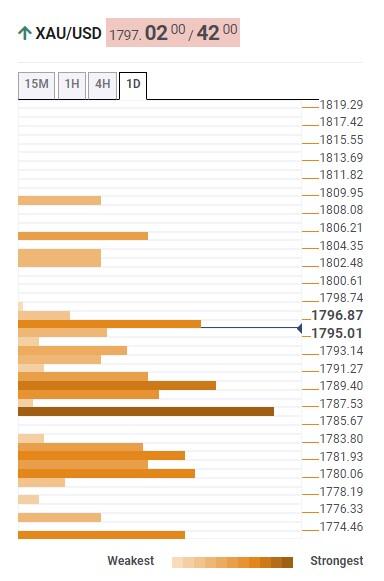
The Technical Confluence Detector shows that the Gold price has fewer hurdles towards the north as it stays beyond the key $1,785 support comprising the previous month's high and Fibonacci 61.8% on daily formation, also known as the golden ratio.
That said, a convergence of the Fibonacci 23.6% on weekly and 38.2% on one day, around $1,791, also acts as short-term key support for XAU/USD.
It should be noted that a clear downside break of the $1,785 support confluence could quickly drag the quote toward the $1,780 mark encompassing 5-DMA and 38.2% on weekly formation.
In a case where the Gold price drops below $1,780, the 10-DMA and Fibonacci 161.8% on the one-day act as the last defense of buyers.
Alternatively, the previous weekly high surrounding $1,806 could test the Gold buyers, for now, before directing them to the Pivot Point one-day R3 near $1,810.
Following that, tops marked during the mid-June around $1,857 and June's monthly peak near $1,880 will be in focus.
Here is how it looks on the tool
About Technical Confluences Detector
The TCD (Technical Confluences Detector) is a tool to locate and point out those price levels where there is a congestion of indicators, moving averages, Fibonacci levels, Pivot Points, etc. If you are a short-term trader, you will find entry points for counter-trend strategies and hunt a few points at a time. If you are a medium-to-long-term trader, this tool will allow you to know in advance the price levels where a medium-to-long-term trend may stop and rest, where to unwind positions, or where to increase your position size.
Information on these pages contains forward-looking statements that involve risks and uncertainties. Markets and instruments profiled on this page are for informational purposes only and should not in any way come across as a recommendation to buy or sell in these assets. You should do your own thorough research before making any investment decisions. FXStreet does not in any way guarantee that this information is free from mistakes, errors, or material misstatements. It also does not guarantee that this information is of a timely nature. Investing in Open Markets involves a great deal of risk, including the loss of all or a portion of your investment, as well as emotional distress. All risks, losses and costs associated with investing, including total loss of principal, are your responsibility. The views and opinions expressed in this article are those of the authors and do not necessarily reflect the official policy or position of FXStreet nor its advertisers. The author will not be held responsible for information that is found at the end of links posted on this page.
If not otherwise explicitly mentioned in the body of the article, at the time of writing, the author has no position in any stock mentioned in this article and no business relationship with any company mentioned. The author has not received compensation for writing this article, other than from FXStreet.
FXStreet and the author do not provide personalized recommendations. The author makes no representations as to the accuracy, completeness, or suitability of this information. FXStreet and the author will not be liable for any errors, omissions or any losses, injuries or damages arising from this information and its display or use. Errors and omissions excepted.
The author and FXStreet are not registered investment advisors and nothing in this article is intended to be investment advice.
Recommended content
Editors’ Picks
AUD/USD sits in familiar range as markets consolidate

AUD/USD is trading at around 0.6680 in early Asian Friday morning following a choppy number of sessions in financial markets. The pair traveled between a high of 0.6755 to a low of 0.6669 on Thursday but closed near its open and in the red as the US Dollar pared earlier losses on Thursday.
EUR/USD: Five-day run for the Euro comes to an end Premium

EUR/USD hit a seven-week high on Thursday, but a stronger US Dollar triggered a correction. The pair failed again to hold above 1.0900 and dropped below 1.0850. The DXY rebounded despite the decline in US yields. On Friday, Eurozone and US PMIs will be watched closely.
Gold aims to shift business above $2,000, US Durable Goods Orders eyed

Gold price is oscillating in a narrow range of $1,990-2,000 in the early Asian session. The precious metal is struggling to shift its auction above the psychological resistance of $2,000. However, the upside looks favored as the Federal Reserve (Fed) has come closer to halting its policy-tightening cycle.
This is how XRP whales and the Ripple community set the altcoin up for a 20% rally
XRP price took the entire crypto market by surprise after the massive spike observed on March 19. The single-day increase was the biggest rise noted by the altcoin since September 2022, which set investors scrambling as they tried to make the most of it.
International outlook: Global Economy Proving Resilient, for Now

Wells Fargo analysts forecast a modestly softer U.S. dollar than previously, and forecast the trade-weighted dollar against the advanced foreign economies to depreciate by 3% by the end of 2023 and a further 5% in 2024