Gold price retreats as traders await for US data, heightened US yields
- Gold holds just below its opening price, constrained by US 10-year Treasury yield rising to 4.272%.
- Traders await US Nonfarm Payrolls, Q3 GDP, and the PCE Price Index, which could influence the Fed's policy outlook.
- Political and geopolitical tensions linger as election polls narrow; though Israel’s conflict with Iran woes begin to fade.

Gold traded slightly below its opening price at the beginning of the week and is down by 0.15%, weighed down by rising US Treasury yields. Market players prepare for a busy economic docket in the United States (US), as the data will be crucial with investors looking for cues for the Federal Reserve’s (Fed) monetary policy path.
The XAU/USD trades at $2,742 after hitting a daily high of $2,747. The yield on the US 10-year Treasury note continued to climb, up by three basis points at 4.272%. This has kept Bullion prices from recording a new all-time high above $2,758 as some analysts eye the $2,800 mark toward the end of the year.
Meanwhile, traders are also eyeing the November 5 US election. According to polling site FiveThirtyEight, Trump's chances of winning the US election have increased to 52% compared to 48% for Vice President Kamala Harris. Despite this, the Democratic nominee still holds a slight lead in most national polls.
Traders are also awaiting a busy economic schedule, which will feature a tranche of job data: JOLTS, ADP Employment Change, Initial Jobless Claims, and Nonfarm Payrolls.
Other data will be revealed like the Gross Domestic Product (GDP) for the third quarter of 2024, the ISM Manufacturing PMI, and the Fed’s preferred inflation gauge — the Personal Consumption Expenditures (PCE) Price Index.
Aside from this, geopolitics came back to the fore over the weekend after Israel launched missiles at several military targets in Iran, avoiding energy and nuclear facilities.
It’s worth noting that Fed officials are in blackout mode as they prepare for the November 7-8 meeting. They will break that period once Chair Jerome Powell speaks at his press conference.
Daily digest market movers: Gold price dips ahead of busy US docket
- The US Dollar Index (DXY), which tracks the Dollar's value against a basket of six currencies, is flat at 104.27.
- On Tuesday, the US schedule will feature the JOLTS Job Openings report for September, which is expected to show a dip from 8.04 million to 7.99 million.
- At the same time, the Conference Board (CB) is expected to release October’s Consumer Confidence reading, which is likely to improve from 98.7 to 99.3.
- The US Bureau of Economic Analysis will reveal Wednesday's GDP for the third quarter. Estimates suggest the economy grew 3% QoQ, unchanged compared to 2024’s second quarter.
- The Atlanta Fed GDP Now model suggests the economy grew by 3.3% in Q3 2024.
- Data from the Chicago Board of Trade, via the December fed funds rate futures contract, shows investors estimate 49 bps of Fed easing by the end of the year.
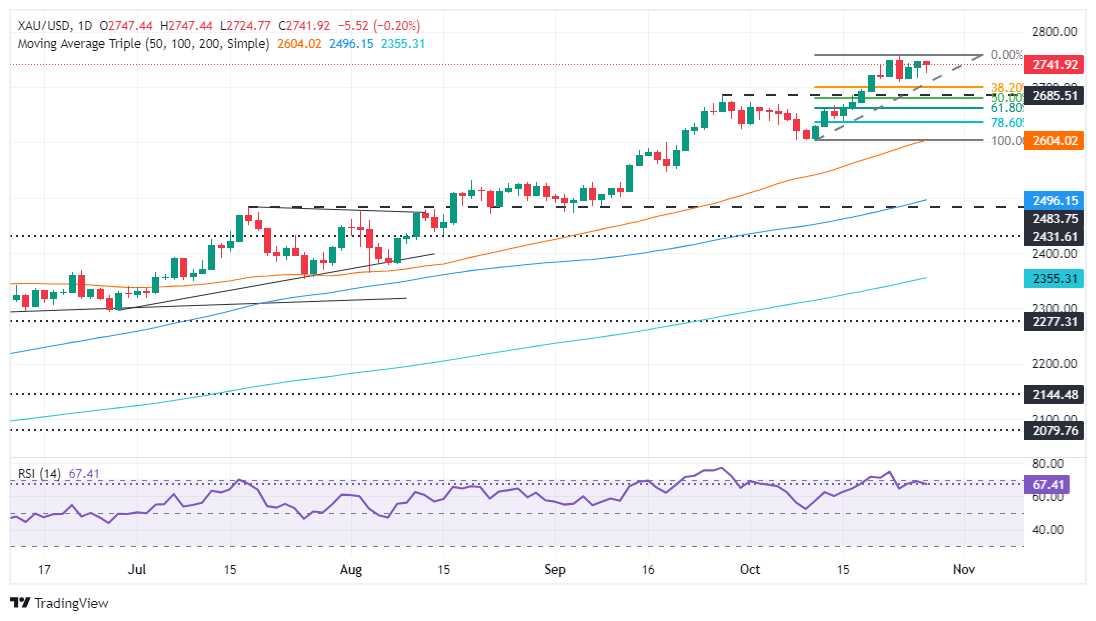
XAU/USD technical outlook: Gold price drops below $2,750
Gold price uptrend remains intact with no reversal pattern around record highs, though it has consolidated within the $2,700-$2,750 area. A breach of the top of the range will immediately expose the all-time high at $2,758. Once surpassed, the next stop would be the $2,775 area before challenging $2,800.
On the other hand, if sellers move in and push prices below $2,700, the first support would be the September 26 swing high, which turned support at $2,685, followed by the 50-day Simple Moving Average (SMA), which turned support at $2,603.
Momentum suggests the non-yielding metal could consolidate as the Relative Strength Index (RSI) remains bullish but aims lower. Until the RSI clears the latest peak, Gold could’ve had the chance to print record highs. Otherwise, beware of a pullback.
Gold FAQs
Gold has played a key role in human’s history as it has been widely used as a store of value and medium of exchange. Currently, apart from its shine and usage for jewelry, the precious metal is widely seen as a safe-haven asset, meaning that it is considered a good investment during turbulent times. Gold is also widely seen as a hedge against inflation and against depreciating currencies as it doesn’t rely on any specific issuer or government.
Central banks are the biggest Gold holders. In their aim to support their currencies in turbulent times, central banks tend to diversify their reserves and buy Gold to improve the perceived strength of the economy and the currency. High Gold reserves can be a source of trust for a country’s solvency. Central banks added 1,136 tonnes of Gold worth around $70 billion to their reserves in 2022, according to data from the World Gold Council. This is the highest yearly purchase since records began. Central banks from emerging economies such as China, India and Turkey are quickly increasing their Gold reserves.
Gold has an inverse correlation with the US Dollar and US Treasuries, which are both major reserve and safe-haven assets. When the Dollar depreciates, Gold tends to rise, enabling investors and central banks to diversify their assets in turbulent times. Gold is also inversely correlated with risk assets. A rally in the stock market tends to weaken Gold price, while sell-offs in riskier markets tend to favor the precious metal.
The price can move due to a wide range of factors. Geopolitical instability or fears of a deep recession can quickly make Gold price escalate due to its safe-haven status. As a yield-less asset, Gold tends to rise with lower interest rates, while higher cost of money usually weighs down on the yellow metal. Still, most moves depend on how the US Dollar (USD) behaves as the asset is priced in dollars (XAU/USD). A strong Dollar tends to keep the price of Gold controlled, whereas a weaker Dollar is likely to push Gold prices up.
Author

Christian Borjon Valencia
FXStreet
Markets analyst, news editor, and trading instructor with over 14 years of experience across FX, commodities, US equity indices, and global macro markets.


