Gold price soars for four-straight days, traders eye key resistance around $2050
- Gold reaches $2,028.44, climbing for the fourth day on China's rate moves and US inflation figures.
- US Treasury yields fall, showing market caution and adjusted expectations for Fed rate cuts amid inflation.
- Market anticipates FOMC minutes for clues on Fed's policy stance, bolstering Gold as an uncertainty hedge.

Gold price rallied for the fourth straight day during the mid-North American session as traders from the United States (US) got back to their desks and digested the latest economic news. News that China lowered interest rates sponsored Gold’s leg-up alongside the drop in US Treasury bond yields.
Meanwhile, last week’s data from the US, with the Consumer Price Index (CPI) and the Producer Price Index (PPI) smashing estimates, sounded alarms that inflation remains stickier than expected. The XAU/USD trades at $2,028.44, up 0.52%.
Trading resumed in the US on Tuesday after Monday's Presidents' Day holiday. US Treasury bond yields edged lower as depicted by the 10-year note yield down four basis points to 4.256%. This is despite investors adopting a cautious stance on the US Federal Reserve (Fed) as data from the Chicago Board of Trade (CBOT) expects the Fed to lower rates by 102 basis points in 2024, less than the 180 bps estimated in mid-January.
Nevertheless, the Greenback (USD) is treading water amid the lack of economic data on the US docket. Traders await the release of the last Federal Open Market Committee (FOMC) Meeting Minutes.
Daily digest market movers: Gold advanced despite investors pushing Fed rate cuts to June
- The CME FedWatch Tool sees traders expect the first 25 bps rate cut by the Fed in June 2024.
- Investors are pricing in 102 basis points of easing throughout 2024.
- The US Dollar Index, tracking the performance of the US Dollar against a basket of six major currencies, is currently trading within a narrow range around 104.20.
- The latest inflation reports from the US triggered a change of language from Fed officials, who struck a “cautious” tone. Atlanta Fed President Raphael Bostic suggested the Fed is in no rush to ease policy.
- San Francisco Fed President Mary Daly stated, “We will need to resist the temptation to act quickly when patience is needed and be prepared to respond agilely as the economy evolves.”
- This week the US economic schedule will feature the release of the latest Federal Reserve Open Market Committee (FOMC) Minutes alongside Fed officials' speeches beginning on Wednesday.
- Traders will get further cues from US S&P Global PMIs, Initial Jobless Claims data and the Chicago Fed National Activity Index, usually a prelude to the Institute for Supply Management's (ISM) Manufacturing PMI.
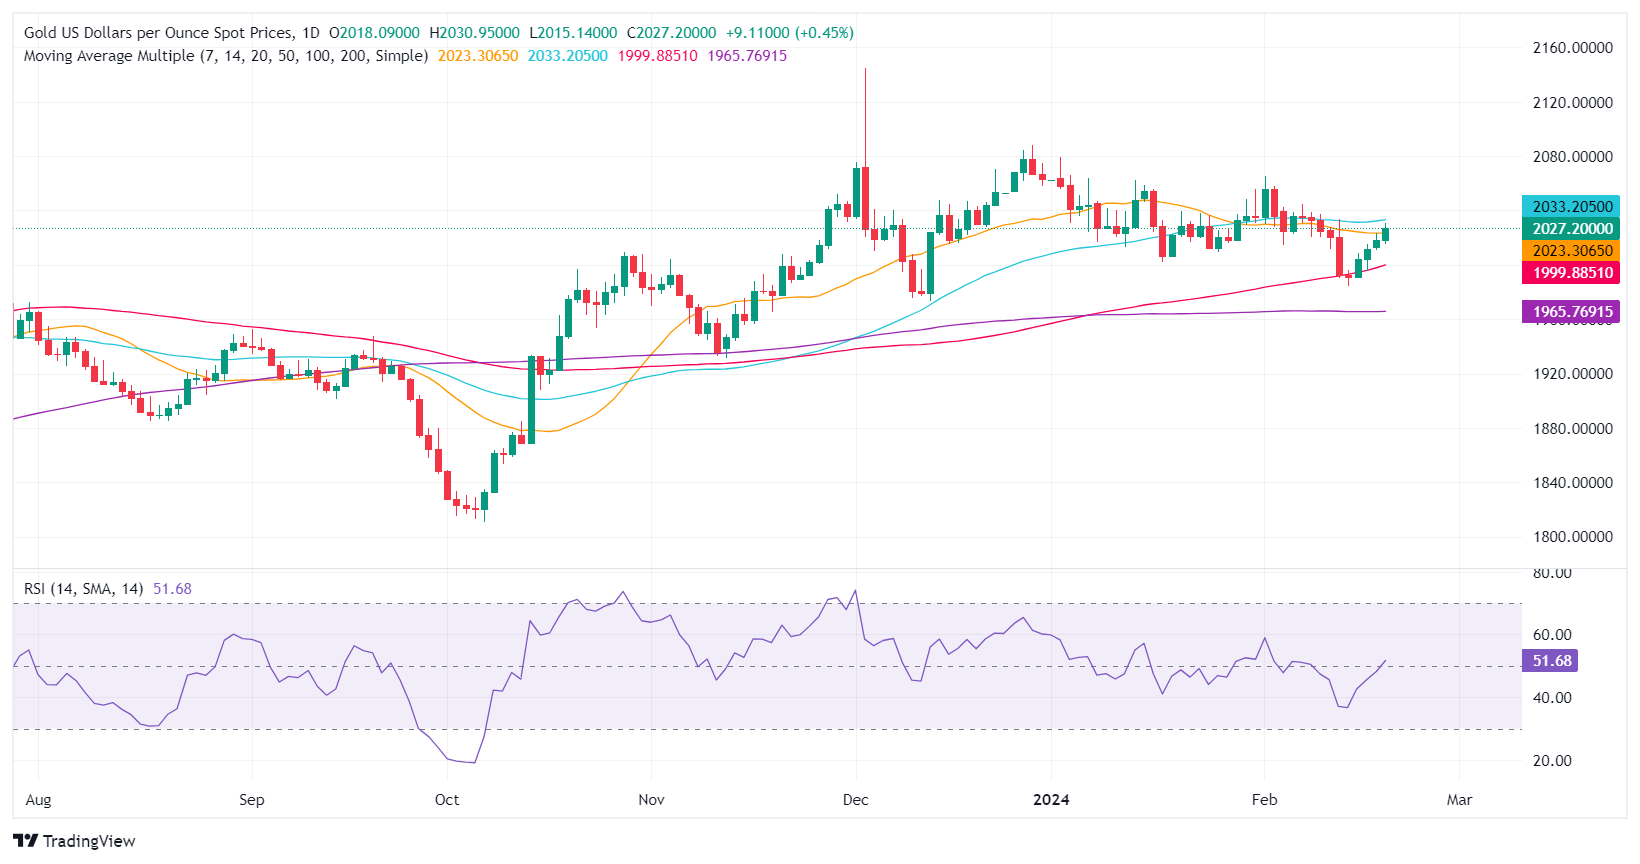
Technical Analysis: Gold stays above 100-day SMA, eyes key resistance near 50-day SMA
Gold´s daily chart portrays the non-yielding metal as neutral to downwardly biased despite staying above the 200-day Simple Moving Average (SMA) at $1,965.46 and extending its gains toward the 50-day SMA at $2,033.69. A breach of the latter will expose $2,050 ahead of the latest cycle high at $2,065.60.
On the flip side, if sellers step in and push prices below the $2,000 figure, that will expose the 100-day SMA at $1,998. The next stop would be the December 13 low at $1,973.13, followed by the 200-day SMA at $1,965.47.
Gold FAQs
Why do people invest in Gold?
Gold has played a key role in human’s history as it has been widely used as a store of value and medium of exchange. Currently, apart from its shine and usage for jewelry, the precious metal is widely seen as a safe-haven asset, meaning that it is considered a good investment during turbulent times. Gold is also widely seen as a hedge against inflation and against depreciating currencies as it doesn’t rely on any specific issuer or government.
Who buys the most Gold?
Central banks are the biggest Gold holders. In their aim to support their currencies in turbulent times, central banks tend to diversify their reserves and buy Gold to improve the perceived strength of the economy and the currency. High Gold reserves can be a source of trust for a country’s solvency. Central banks added 1,136 tonnes of Gold worth around $70 billion to their reserves in 2022, according to data from the World Gold Council. This is the highest yearly purchase since records began. Central banks from emerging economies such as China, India and Turkey are quickly increasing their Gold reserves.
How is Gold correlated with other assets?
Gold has an inverse correlation with the US Dollar and US Treasuries, which are both major reserve and safe-haven assets. When the Dollar depreciates, Gold tends to rise, enabling investors and central banks to diversify their assets in turbulent times. Gold is also inversely correlated with risk assets. A rally in the stock market tends to weaken Gold price, while sell-offs in riskier markets tend to favor the precious metal.
What does the price of Gold depend on?
The price can move due to a wide range of factors. Geopolitical instability or fears of a deep recession can quickly make Gold price escalate due to its safe-haven status. As a yield-less asset, Gold tends to rise with lower interest rates, while higher cost of money usually weighs down on the yellow metal. Still, most moves depend on how the US Dollar (USD) behaves as the asset is priced in dollars (XAU/USD). A strong Dollar tends to keep the price of Gold controlled, whereas a weaker Dollar is likely to push Gold prices up.
Author

Christian Borjon Valencia
FXStreet
Markets analyst, news editor, and trading instructor with over 14 years of experience across FX, commodities, US equity indices, and global macro markets.


