Gold Price Analysis: XAU/USD retreats from five-month highs towards $1910
- Gold awaits fresh clues after posting the heaviest monthly jump since July 2020.
- S&P 500 Futures print mild gains as stimulus, unlock optimism entertain bulls following US/UK off.
- Downbeat DXY back the bulls to battle US-China tussles, doubts over reflation, Fed action probe buyers.
- All eyes on NFP, US infrastructure spending talks and Fedspeak.

Update: Gold price is retreating from five-month highs of $1917, looking to test the $1910 round number. The latest leg down comes amid a pause in the US dollar decline across the board, as the rally in the Treasury yields recover ground. The underlying bullish tone remains intact around gold amid growing inflationary pressures while investors await the US ISM Manufacturing PMI for fresh hints on the US economic recovery and Fed’s monetary policy. Technically, gold has reversed to the downside after running into stiff resistance at the January 8 high at $1918.
Read: The key drivers for the week ahead
Gold (XAU/USD) remains on the front foot, despite recently easing above $1,900, amid the early Asian trading session on Tuesday. That said, the yellow metal buyers catch a breather around $1,907 after rising for the two consecutive months at the start of June.
Mild gains of S&P 500 Futures could be spotted for gold’s recent positive performance. Though, broad US dollar weakness becomes the main catalysts to help the commodity post the biggest run-up in 11 months.
Although a long weekend in the US and the UK probed market moves the previous day, the US dollar index (DXY) remained on the back foot as hopes of further stimulus and steady vaccinations in the West, recent in Asia as well, improved risk appetite for the metal. Having proposed a $6.0 trillion budget, US President Joe Biden stretched talks over his $1.7 trillion infrastructure spending to June even as tax hikes become the key hurdle for the much-awaited stimulus.
Elsewhere, mostly stable vaccinations seem to have led the developed economies toward the unlock conditions citizens were waiting for. Even if Japan and Australia are yet to convey progress in the coronavirus (COVID-19) conditions at home, Germany is up for removing the virus-led restrictions, per Bloomberg, as they end in June.
On the contrary, uncertainties over the US Federal Reserve’s (Fed) next move, amid a jump in inflation fears, weigh on the market sentiment. Also on the same line were the latest tensions between China and Western friends including Australia and New Zealand. After Friday’s upbeat Core PCE Price Index, the Fed’s preferred gauge of inflation, market plays are expecting the Fed policymakers to shed their bearish bias and hint for the tapering as they come closer to the blackout period ahead of June’s FOMC.
Other than the Fedspeak, Friday’s US Nonfarm Payrolls (NFP) also become an important catalyst to watch for gold traders as markets look for consolidation in the previous month’s disappointment. Should the headline US jobs figures print upbeat figures, traders may have an additional reason to expect the Fed action during the upcoming Federal Open Market Committee (FOMC), which in turn may underpin the US dollar and drag the gold prices.
On an intraday basis, gold traders may keep their eyes on China PMIs and how Western traders react to the latest reflation fears. It should, however, be noted that the US dollar weakness can keep gold buyers hopeful but Treasury yields should be watched closely for immediate direction as the major bond markets were off on Monday and traders could offer an active start to the week.
Technical analysis
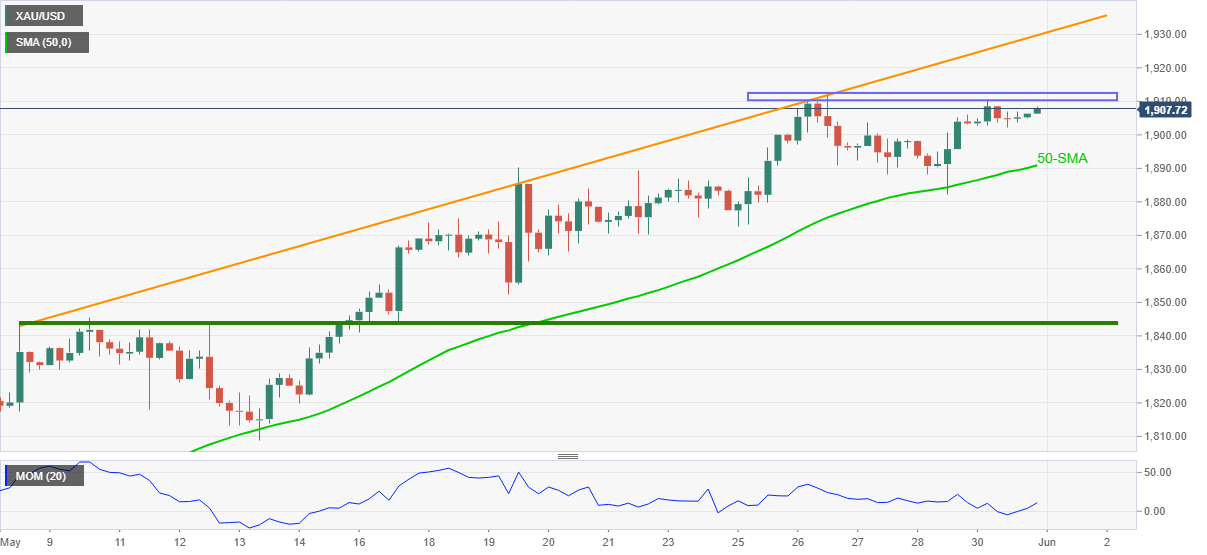
Gold remains on the front foot, recently backed by the 50-SMA and recovery in the Momentum line.
However, a one-week-old horizontal hurdle near $1,910-11 holds the key to the metal’s run-up towards a one-month-old ascending trend line around $1,930.
While gold buyers are likely to take a breaker close to $1,930, any further upside won’t hesitate to challenge the yearly top surrounding $1,960.
Meanwhile, the $1,900 threshold can offer immediate support to the gold prices ahead of the 50-SMA level near $1,890 and the $1,875-73 support zone.
In a case where gold bears dominate past $1,873, the early May levels near $1,845 should return to the chart.
Gold four-hour chart
Trend: Bullish
Previous Update
Update: Having booked the best monthly rise in ten months, gold price remains unstoppable, as it clinches fresh five-month highs near $1915 starting out a fresh month. The persistent downbeat tone around the US dollar, in response to Fed’s policy expectations, continue to underpin gold price. Meanwhile, concerns over rising price pressures globally also benefit the hedge against inflation gold. The latest leg up in gold drives the bulls towards the January 8 high of $1918. Investors eagerly await Friday’s US Nonfarm Payrolls data for fresh hints on the economic recovery, which could likely affect the Fed’s policy outlook and in turn gold price.
Author

Anil Panchal
FXStreet
Anil Panchal has nearly 15 years of experience in tracking financial markets. With a keen interest in macroeconomics, Anil aptly tracks global news/updates and stays well-informed about the global financial moves and their implications.


