|

Gold Price Analysis: XAU/USD stays en route $1,777 on NFP day – Confluence Detector

Gold consolidates the heaviest losses in over a month around $1,795 during early Friday. The yellow metal dropped to a nine-week low the previous day before recovering from $1,785.

While the broad US dollar gains remain on the table, which has been weighing on gold prices off-late, the pre-NFP trading lull seems to challenge the commodity trading by press time. That said, the US dollar index (DXY) rises to a fresh high since December 01 while the market’s risk barometer in Asia, S&P 500 Future, also prints mild gains.

Moving on, the US Nonfarm Payrolls (NFP) and Unemployment Rate for January will be the key for the global markets amid hopes of recovery in the world’s largest economy.

Read: Nonfarm Payrolls Preview: Dollar needs a strong number to keep rallying

Gold: Key levels to watch

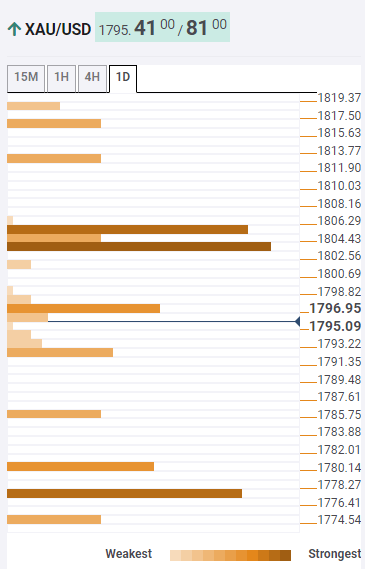
Despite the recent corrective pullback, gold remains below the key resistance area around $1,805, not to mention the adjacent hurdle near $1,797. As a result, sellers are well directed towards Pivot Point 1 support on the monthly chart, near $1,777.

However, the previous day’s low around $1,785 can offer an intermediate halt during the fall. Also filtering the moves could be the third support of pivot on weekly formation around $1,781.

Meanwhile, the previous high on 4H and 15-minutes join 23.6% Fibonacci retracement of the daily chart (1D) to guard immediate upside around $1,797.

Following that, the previous month’s low and SMA5 on 4H join 38.2% Fibonacci retracement level on 1D to highlight $1,804 as the resistance.

It should be noted that the pivot point support two on the weekly chart as well as SMA 100 on 15-minute play strengthens the resistance region around $1,805.

Here is how it looks on the tool
fxsoriginal

About Confluence Detector

The TCI (Technical Confluences Indicator) is a tool to locate and point out those price levels where there is a congestion of indicators, moving averages, Fibonacci levels, Pivot Points, etc. Knowing where these congestion points are located is very useful for the trader, and can be used as a basis for different strategies.

Author

Anil Panchal

Anil Panchal

FXStreet

Anil Panchal has nearly 15 years of experience in tracking financial markets. With a keen interest in macroeconomics, Anil aptly tracks global news/updates and stays well-informed about the global financial moves and their implications.


More from Anil Panchal
Share:

Editor's Picks

AUD/USD flirts with 0.7000, lowest since early August amid bullish USD

AUD/USD hits a fresh low since early August during the Asian session on Friday and looks vulnerable near 0.7000 after breaking below the 200-day SMA overnight. Against the backdrop of the hawkish Fed, a two-day rally in oil prices revives inflation fears and continues to push US bond yields to multi-year highs. Adding to this, geopolitical risks lift the US Dollar to a two-month high, overshadowing RBA rate hike bets and weighing on the pair.

USD/JPY pulls back from three-week high after failing near 159.00

USD/JPY edges lower during the Asian session on Friday, stalling its recent strong move to a three-week high of 159.00 as Japanese Yen bears turn cautious amid intervention fears. Meanwhile, the US Dollar retains a strong bullish undertone as the Fed's hawkish outlook and oil-driven inflation fears continue to push US bond yields to multi-year peaks. Furthermore, the BoJ's dovish rate hike last week might cap JPY and support spot prices.

Gold treads water below $4,300

Gold grabs some buying attention and advances marginally at the end of the week, partially retracing the weekly decline, although it is still navigating below the key $4,300 mark per troy ounce. The fresh selling bias on the Greenback and the modest decline in US Treasury yields appear to support the humble advance in the precious metal.

Crypto Today: Bitcoin and Ethereum edge lower, XRP extends recovery as macro headwinds weigh

The broader cryptocurrency market is consolidating on Friday, with Bitcoin paring losses slightly above $84,000. Ethereum declines in tandem with BTC. Ripple (XRP), meanwhile, paints a different picture.


Fed vs BoJ: Both hiked. The market only believes one of them – and the chart shows which
The Federal Reserve (Fed) and the Bank of Japan (BoJ) have just done something remarkably similar. Both central banks raised interest rates by 25 basis points (bps) last week, both are confronting inflation risks, and both signal that future decisions will depend on incoming economic data.
Fed vs BoJ: Both hiked. The market only believes one of them – and the chart shows which

The Fed and the BoJ have just done something remarkably similar. Both central banks raised interest rates by 25 bps last week, both are confronting inflation risks, and both signal that future decisions will depend on incoming economic data.













